Prescott Football Manufacturing had the following operating results for 2019: sales = $30,074; cost of goods...
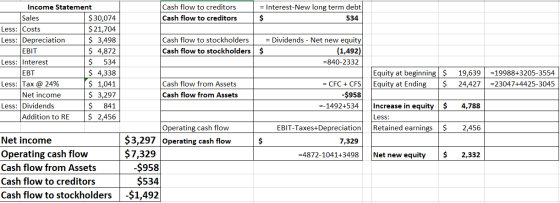
Prescott Football Manufacturing had the following operating results for 2019: sales = $30,074; cost of goods sold = $21,704; depreciation expense = $3,498; interest expense = $534; dividends paid = $841. At the beginning of the year, net fixed assets were $19,988, current assets were $3,205, and current liabilities were $3,554. At the end of the year, net fixed assets were $23,047, current assets were $4,425, and current liabilities were $3,045. The tax rate for 2019 was 24 percent.
a. What is net income for 2019?
b. What is the operating cash flow for 2019?
c. What is the cash flow from assets for 2019?
d. Assume no new debt was issued during the year. What is the cash flow to creditors for 2019?
e. Assume no new debt was issued during the year. What is the cash flow to stockholders for 2019?
Homework Answers
*Please rate thumbs up
Add Answer to:
Prescott Football Manufacturing had the following operating
results for 2019: sales = $30,074; cost of goods...
Prescott Football Manufacturing had the following operating results for 2019: sales = $30,074; cost of goods...
 Prescott Football Manufacturing had the following operating results for 2019: sales = $30,074; cost of goods sold = $21,704; depreciation expense = $3,498; interest expense = $534; dividends paid = $841. At the beginning of the year, net fixed assets were $19,988, current assets were $3,205, and current liabilities were $3,554. At the end of the year, net fixed assets were $23,047, current assets were $4,425, and current liabilities were $3,045. The tax rate for 2019 was 24 percent. a....
Prescott Football Manufacturing had the following operating results for 2019: sales = $30,724; cost of goods...
Prescott Football Manufacturing had the following operating results for 2019: sales = $30,724; cost of goods sold = $21,938; depreciation expense = $3,589; interest expense = $599; dividends paid = $893. At the beginning of the year, net fixed assets were $20,365, current assets were $2,061, and current liabilities were $4,997. At the end of the year, net fixed assets were $23,242, current assets were $4,568, and current liabilities were $3,253. The tax rate for 2019 was 22 percent. a. ...
Prescott Football Manufacturing had the following operating results for 2019: sales = $30,774; cost of goods...
 Prescott Football Manufacturing had the following operating results for 2019: sales = $30,774; cost of goods sold = $21,956, depreciation expense = $3,596, interest expense = $604, dividends paid = $897. At the beginning of the year, net fixed assets were $20,394, current assets were $1,973, and current liabilities were $5,108. At the end of the year, net fixed assets were $23,257, current assets were $4,579, and current liabilities were $3,269. The tax rate for 2019 was 23 percent. a....
Calculating Cash Flows Prescott Football Manufacturing had the following operating results for 2019: sales = $29,874;...
 Calculating Cash Flows Prescott Football Manufacturing had the following operating results for 2019: sales = $29,874; cost of goods sold = $21,632; depreciation expense = $3,470; interest expense = $514; dividends paid = $825. At the beginning of the year, net fixed assets were $19,872, current assets were $3,557, and current liabilities were $3,110. At the end of the year, net fixed assets were $22,987, current assets were $4,381, and current liabilities were $2,981. The tax rate for 2019 was...
Titan Football Manufacturing had the following operating results for 2016: sales = $19,880; cost of goods...
 Titan Football Manufacturing had the following operating results for 2016: sales = $19,880; cost of goods sold-S1 3,880; depreciation expense = $2,270 interest expense = $295; dividends paid-$650. At the beginning of the year, net fixed assets were $18,800, current assets were $3,040, and current liabilities were $1,970. At the end of the year, net fixed assets were $22,340, current assets were $3,480, and current liabilities were $2,060. The tax rate for 2016 was 40 percent. a. What is net...
Titan Football Manufacturing had the following operating results for 2016: sales = $19,930; cost of goods...
Titan Football Manufacturing had the following operating results for 2016: sales = $19,930; cost of goods sold = $13,830; depreciation expense = $2,220; interest expense = $270; dividends paid = $700. At the beginning of the year, net fixed assets were $21,300, current assets were $3,090, and current liabilities were $1,920. At the end of the year, net fixed assets were $25,340, current assets were $3,580, and current liabilities were $2,010. The tax rate for 2016 was 30 percent. a....
Titan Football Manufacturing had the following operating results for 2016: sales = $19,870; cost of goods...
Titan Football Manufacturing had the following operating results for 2016: sales = $19,870; cost of goods sold = $13,890; depreciation expense = $2,280; interest expense = $300; dividends paid = $640. At the beginning of the year, net fixed assets were $18,300, current assets were $3,030, and current liabilities were $1,980. At the end of the year, net fixed assets were $21,740, current assets were $3,460, and current liabilities were $2,070. The tax rate for 2016 was 40 percent. a....
Titan Football Manufacturing had the following operating results for 2016: sales = $19,940; cost of goods...
Titan Football Manufacturing had the following operating results for 2016: sales = $19,940; cost of goods sold = $13,820; depreciation expense = $2,210; interest expense = $265; dividends paid = $710. At the beginning of the year, net fixed assets were $21,800, current assets were $3,100, and current liabilities were $1,910. At the end of the year, net fixed assets were $25,940, current assets were $3,600, and current liabilities were $2,000. The tax rate for 2016 was 40 percent. a....
Cusic Industries had the following operating results for 2015: sales = $30,180; cost of goods sold...
Cusic Industries had the following operating results for 2015: sales = $30,180; cost of goods sold = $19,860; depreciation expense = $5,340; interest expense = $2,790; dividends paid = $1,550. At the beginning of the year, net fixed assets were $17,210, current assets were $5,880, and current liabilities were $3,375. At the end of the year, net fixed assets were $20,760, current assets were $7,600, and current liabilities were $4,000. The tax rate for 2015 was 30 percent. What was...
Blue Diamond Industries had the following operating results for 2017: sales = $28,560; cost of goods...
Blue Diamond Industries had the following operating results for 2017: sales = $28,560; cost of goods sold = $19,460; depreciation expense = $5,020; interest expense = $2,340; dividends paid = $1,150. At the beginning of the year, net fixed assets were $16,980, current assets were $5,800, and current liabilities were $3,280. At the end of the year, net fixed assets were $20,360, current assets were $7,360, and current liabilities were $3,900. The tax rate was 30 percent. a. What was...
 Prescott Football Manufacturing had the following operating results for 2019: sales = $30,074; cost of goods sold = $21,704; depreciation expense = $3,498; interest expense = $534; dividends paid = $841. At the beginning of the year, net fixed assets were $19,988, current assets were $3,205, and current liabilities were $3,554. At the end of the year, net fixed assets were $23,047, current assets were $4,425, and current liabilities were $3,045. The tax rate for 2019 was 24 percent. a....
 Prescott Football Manufacturing had the following operating results for 2019: sales = $30,774; cost of goods sold = $21,956, depreciation expense = $3,596, interest expense = $604, dividends paid = $897. At the beginning of the year, net fixed assets were $20,394, current assets were $1,973, and current liabilities were $5,108. At the end of the year, net fixed assets were $23,257, current assets were $4,579, and current liabilities were $3,269. The tax rate for 2019 was 23 percent. a....
 Calculating Cash Flows Prescott Football Manufacturing had the following operating results for 2019: sales = $29,874; cost of goods sold = $21,632; depreciation expense = $3,470; interest expense = $514; dividends paid = $825. At the beginning of the year, net fixed assets were $19,872, current assets were $3,557, and current liabilities were $3,110. At the end of the year, net fixed assets were $22,987, current assets were $4,381, and current liabilities were $2,981. The tax rate for 2019 was...
 Titan Football Manufacturing had the following operating results for 2016: sales = $19,880; cost of goods sold-S1 3,880; depreciation expense = $2,270 interest expense = $295; dividends paid-$650. At the beginning of the year, net fixed assets were $18,800, current assets were $3,040, and current liabilities were $1,970. At the end of the year, net fixed assets were $22,340, current assets were $3,480, and current liabilities were $2,060. The tax rate for 2016 was 40 percent. a. What is net...
Most questions answered within 3 hours.
-
While rotating the tires on your car you notice a rock [mass =
0.1 Kg] stuck...
asked 1 hour ago -
Using MARS simulator, write MIPS programs according to
the following scenarios: Receive a positive integer number...
asked 3 hours ago -
An object in front of a concave mirror has a real image that is
11.5 cm...
asked 3 hours ago -
Consider the reaction, C3 H8 + O2 --> CO2 + H2O. How many
moles of O2...
asked 5 hours ago -
You and your opponent both roll a fair die. If you both roll the
same number,...
asked 5 hours ago -
In a study of the accuracy of fast food drive-through orders,
Restaurant A had 257 accurate...
asked 5 hours ago -
Identify and describe in detail the four categories of
institutions that could be included in a...
asked 5 hours ago -
In python
class Customer:
def __init__(self, customer_id, last_name, first_name, phone_number, address):
self._customer_id = int(customer_id)
self._last_name =...
asked 6 hours ago -
What is an example of a limitation in implementing a new
ERP system and how it...
asked 5 hours ago -
In a section of 9.7cm of an artery with a radius of 2.6mm there
is a...
asked 5 hours ago -
the two carboxylic acid groups of aspartic acid have different
acidities with pKa values of 2.1...
asked 6 hours ago -
Would CuCO3 aqueous salt combined with calcium chloride
form a solid precipitate? If so, what would...
asked 6 hours ago