
Homework Answers
Ans:
Explanation:
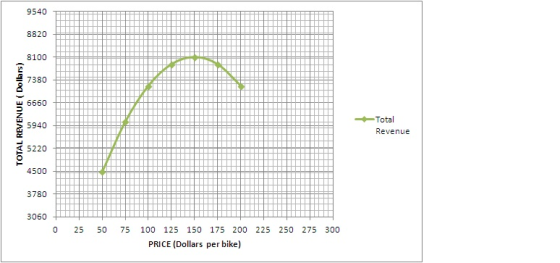
Total revenue = Price * Quantity
|
Price ($) |
Quantity (Bikes) |
Total Revenue ($) |
| 50 | 90 | 4500 |
| 75 | 81 | 6075 |
| 100 | 72 | 7200 |
| 125 | 63 | 7875 |
| 150 | 54 | 8100 |
| 175 | 45 | 7875 |
| 200 | 36 | 7200 |
Ans: According to the midpoint method, the price elasticity of demand between points A and B is approximately - 0.14
Explanation:
Initial price ( P1) = $50
New price ( P2 ) = $25
Initial quantity ( Q1) = 90
New quantity ( Q2) = 99
PED = ∆Q/∆P *( P1 + P2 / Q1 + Q2)
= {( 99 - 90 ) / ( 25 - 50 ) } * {( 50 + 25 ) / ( 90 + 99)}
= ( 9 / -25 ) * ( 75 / 189)
= -0.36 * 0.3968
= - 0.14 or 0.14 ( absolute value )
Ans: Suppose the price of bikes is currently $25 per bike , shown as point B on the initial graph. Because the demand between points A and B is inelastic, a $25 -per- bike increase in price will lead to increase in total revenue per day.
Ans: In general, in order for a price decrease to cause a decrease in total revenue, demand must be inelastic.
Explanation:
When demand is inelastic , then decrease in price will lead a decrease in total revenue.
When demand is inelastic , then increase in price will lead an increase in total revenue.
Add Answer to:
Total Revenue PRICE (Dollars per bike) O HAHAHAHA 9 18 27 36 45 54 63 QUANTITY...
Attempts: Average: 1 4 6. Elasticity and total revenue The following graph shows the daily demand...
 Attempts: Average: 1 4 6. Elasticity and total revenue The following graph shows the daily demand curve for bikes in Denver. Use the green rectangle (triangle symbols) to compute total revenue at various prices along the demand curve. Note: You will not be graded on any changes made to this graph. 300 275 250 225 a 200 Total Revenue We were unable to transcribe this imageWe were unable to transcribe this imageS 1740 1500 t 1260 1020 o 25 50...
6. Elasticity and total revenue The following graph shows the dally demand curve for bikes in...
 6. Elasticity and total revenue The following graph shows the dally demand curve for bikes in New York City. Use the green rectangle (triangle symbols) to compute total revenue at various prices along the demand curve Note: You will not be graded on any changes made to this graph. 300 275 250 225 Total Revenue 175 150 125 100 75 50 03 6912 1518 21 24 27 30 33 36 QUANTITY (Bikes) On the following graph, use the green point...
PLEASE READ VERY CAREFULLY!! SHOW ALL THE CALCULATIONS! AND LIST ALL THE TOTAL REVENUE COORDINATE POINTS!!...
 PLEASE READ VERY CAREFULLY!! SHOW ALL THE CALCULATIONS! AND LIST
ALL THE TOTAL REVENUE COORDINATE POINTS!!
ANSWER OPTIONS FOR NUMBER 1: 0, 0.6, 1.67,
75.02
2. ELASTIC, UNIT ELASTIC, INELASTIC
3. A DECREASE, AN INCREASE, NO CHANGE
4. ELASTIC, UNIT ELASTIC, INELASTIC
Use the green rectangle (triangle symbols) to compute total revenue at various prices along the demand curve. Note: You will not be graded on any changes made to this graph. 300 275 250 Total Revenue 225 200 2...
PLEASE READ VERY CAREFULLY!! SHOW ALL THE CALCULATIONS! AND LIST
ALL THE TOTAL REVENUE COORDINATE POINTS!!
ANSWER OPTIONS FOR NUMBER 1: 0, 0.6, 1.67,
75.02
2. ELASTIC, UNIT ELASTIC, INELASTIC
3. A DECREASE, AN INCREASE, NO CHANGE
4. ELASTIC, UNIT ELASTIC, INELASTIC
Use the green rectangle (triangle symbols) to compute total revenue at various prices along the demand curve. Note: You will not be graded on any changes made to this graph. 300 275 250 Total Revenue 225 200 2...
The following graph shows the daily demand curve for bikes in New York City. Use the...
 The following graph shows the daily demand curve for bikes in New York City. Use the green rectangle (triangle symbols) to compute total revenue at various prices along the demand curve. Note: You will not be graded on any changes made to this graph. ? 300 275 250 Total Revenue 225 200 175 PRICE (Dollars per bike) 150 A 125 B 100 75 50 25 Demand 0 0 3 6 9 27 30 33 36 12 15 18 21 24...
PLEASE DOUBLE CHECK MY WORK!!! WRITING MUST BE CLEAR TO READ!!!! 0 0.6 1.67 75.02 The...
 PLEASE DOUBLE CHECK MY WORK!!! WRITING MUST BE CLEAR TO
READ!!!!
0
0.6
1.67
75.02
The tollowing graph shows the daily demand curve tor bikes in Houston. Use the green rectangle (triangle symbols) to compute total revenue at various prices along the demand curve Note: You will not be graded on any changes made to this graph 275 250 225 200 2 175 T Total Revenue T150 125 T 0 10 20 30 40 50 60 70 80 90 100...
PLEASE DOUBLE CHECK MY WORK!!! WRITING MUST BE CLEAR TO
READ!!!!
0
0.6
1.67
75.02
The tollowing graph shows the daily demand curve tor bikes in Houston. Use the green rectangle (triangle symbols) to compute total revenue at various prices along the demand curve Note: You will not be graded on any changes made to this graph 275 250 225 200 2 175 T Total Revenue T150 125 T 0 10 20 30 40 50 60 70 80 90 100...
On the following graph, use the green point (triangle symbol) to plot the annual total revenue...
 On the following graph, use the green point (triangle symbol) to plot the annual total revenue when the market price is $50, $75, $100, $125, $150, $175, and $200 per bike. According to the midpoint method, the price elasticity of demand between points A and B is approximately _______ . Suppose the price of bikes is currently $200 per bike, shown as point A on the initial graph. Because the demand between points A and B is _______ ,a $25-per-bike decrease in...
6. Elasticity and total revenue The following graph shows the daily demand curve for bikes in...
 6. Elasticity and total revenue The following graph shows the daily demand curve for bikes in Denver Use the green rectangle (triangle symbols) to compute total revenue at various prices along the demand cur Note: You will not be graded on any changes made to this graph.On the following graph, use the green point (triangle symbol) to plot the annual total revenue when the market price is $50, $75, $100, $125, $150, $175, and $200 per bike. According to the midpoint method, the price...
6. Elasticity and total revenue The following graph shows the daily demand curve for bikes in...
 6. Elasticity and total revenueThe following graph shows the daily demand curve for bikes in Dallas.Use the green rectangle (triangle symbols) to compute total revenue at various prices along the demand curve.Note: You will not be graded on any changes made to this graph.On the following graph, use the green point (triangle symbol) to plot the annual total revenue when the market price is $ 50, $ 75, $ 100, $ 125, $ 150, $ 175, and $ 200 per...
Use the green rectangle (triangle symbols) to compute total revenue at various prices along the demand...
 Use the green rectangle (triangle symbols) to compute total revenue at various prices along the demand curve. Note: You will not be graded on any changes made to this graph. On the following graph, use the green point (triangle symbol) to plot the annual total revenue when the market price is $50, $75, $100, $125, $150, $175, and $200 per bike. According to the midpoint method, the price elasticity of demand between points A and B is approximately _______ Suppose the price of...
Use the green rectangle (triangle symbols) to compute total revenue at various prices along the demand curve.
 Use the green rectangle (triangle symbols) to compute total revenue at various prices along the demand curve. Note: You will not be graded on any changes made to this graph. On the following graph, use the green point (triangle symbol) to plot the annual total revenue when the market price is $50, $75, $100, $125, $150, $175, and $200 per bike. According to the midpoint method, the price elasticity of demand between points A and B is approximately _______ .Suppose the price of...
 Attempts: Average: 1 4 6. Elasticity and total revenue The following graph shows the daily demand curve for bikes in Denver. Use the green rectangle (triangle symbols) to compute total revenue at various prices along the demand curve. Note: You will not be graded on any changes made to this graph. 300 275 250 225 a 200 Total Revenue We were unable to transcribe this imageWe were unable to transcribe this imageS 1740 1500 t 1260 1020 o 25 50...
 6. Elasticity and total revenue The following graph shows the dally demand curve for bikes in New York City. Use the green rectangle (triangle symbols) to compute total revenue at various prices along the demand curve Note: You will not be graded on any changes made to this graph. 300 275 250 225 Total Revenue 175 150 125 100 75 50 03 6912 1518 21 24 27 30 33 36 QUANTITY (Bikes) On the following graph, use the green point...
 PLEASE READ VERY CAREFULLY!! SHOW ALL THE CALCULATIONS! AND LIST
ALL THE TOTAL REVENUE COORDINATE POINTS!!
ANSWER OPTIONS FOR NUMBER 1: 0, 0.6, 1.67,
75.02
2. ELASTIC, UNIT ELASTIC, INELASTIC
3. A DECREASE, AN INCREASE, NO CHANGE
4. ELASTIC, UNIT ELASTIC, INELASTIC
Use the green rectangle (triangle symbols) to compute total revenue at various prices along the demand curve. Note: You will not be graded on any changes made to this graph. 300 275 250 Total Revenue 225 200 2...
PLEASE READ VERY CAREFULLY!! SHOW ALL THE CALCULATIONS! AND LIST
ALL THE TOTAL REVENUE COORDINATE POINTS!!
ANSWER OPTIONS FOR NUMBER 1: 0, 0.6, 1.67,
75.02
2. ELASTIC, UNIT ELASTIC, INELASTIC
3. A DECREASE, AN INCREASE, NO CHANGE
4. ELASTIC, UNIT ELASTIC, INELASTIC
Use the green rectangle (triangle symbols) to compute total revenue at various prices along the demand curve. Note: You will not be graded on any changes made to this graph. 300 275 250 Total Revenue 225 200 2...
 The following graph shows the daily demand curve for bikes in New York City. Use the green rectangle (triangle symbols) to compute total revenue at various prices along the demand curve. Note: You will not be graded on any changes made to this graph. ? 300 275 250 Total Revenue 225 200 175 PRICE (Dollars per bike) 150 A 125 B 100 75 50 25 Demand 0 0 3 6 9 27 30 33 36 12 15 18 21 24...
 PLEASE DOUBLE CHECK MY WORK!!! WRITING MUST BE CLEAR TO
READ!!!!
0
0.6
1.67
75.02
The tollowing graph shows the daily demand curve tor bikes in Houston. Use the green rectangle (triangle symbols) to compute total revenue at various prices along the demand curve Note: You will not be graded on any changes made to this graph 275 250 225 200 2 175 T Total Revenue T150 125 T 0 10 20 30 40 50 60 70 80 90 100...
PLEASE DOUBLE CHECK MY WORK!!! WRITING MUST BE CLEAR TO
READ!!!!
0
0.6
1.67
75.02
The tollowing graph shows the daily demand curve tor bikes in Houston. Use the green rectangle (triangle symbols) to compute total revenue at various prices along the demand curve Note: You will not be graded on any changes made to this graph 275 250 225 200 2 175 T Total Revenue T150 125 T 0 10 20 30 40 50 60 70 80 90 100...
 6. Elasticity and total revenue The following graph shows the daily demand curve for bikes in Denver Use the green rectangle (triangle symbols) to compute total revenue at various prices along the demand cur Note: You will not be graded on any changes made to this graph.On the following graph, use the green point (triangle symbol) to plot the annual total revenue when the market price is $50, $75, $100, $125, $150, $175, and $200 per bike. According to the midpoint method, the price...
Most questions answered within 3 hours.
-
2) You are given the task of finding a representation for a
circle in a drawing...
asked 20 minutes ago -
STUDY QUESTION: Does use of diet drug fen-phen
(fenfluramine-phentermine) cause valvular heart disease?
HINT: Valvular heart...
asked 12 minutes ago -
1. An object weighing 40 N rests on a surface. The coefficient
of friction is 0.35....
asked 1 hour ago -
Investor company owns 35% of investee company voting stock and
accounts for the investment under the...
asked 2 hours ago -
The number of major faults on a randomly chosen 1 km stretch of
highway has a...
asked 2 hours ago -
Consider the competitive environment of Starbuck's, Progressive
Insurance, a manufacturing firm with low turnover, or a...
asked 3 hours ago -
3. Gains from trade
Consider two neighbouring island countries called Euphoria and
Contente. They each have...
asked 5 hours ago -
A business executive has the option to invest money in two
plans: Plan A guarantees that...
asked 7 hours ago -
Hello, can someone please help me answer this question?
How much heat is absorbed by a...
asked 7 hours ago -
. A marketing researcher conducted a survey of 25 shoppers
randomly selected at the local mall...
asked 8 hours ago -
Create an comprehensive response to the
following:
Antimicrobial agents work on a multitude of microbes (bacteria,...
asked 8 hours ago -
6.13 LAB: Step counter. Section 6.3.
A pedometer treats walking 2,000 steps as walking 1 mile....
asked 8 hours ago