PLEASE ANSWER QUESTIONS CAREFULLY & ANSWERS MUST BE CLEAR TO READ! THANKS!
Homework Answers
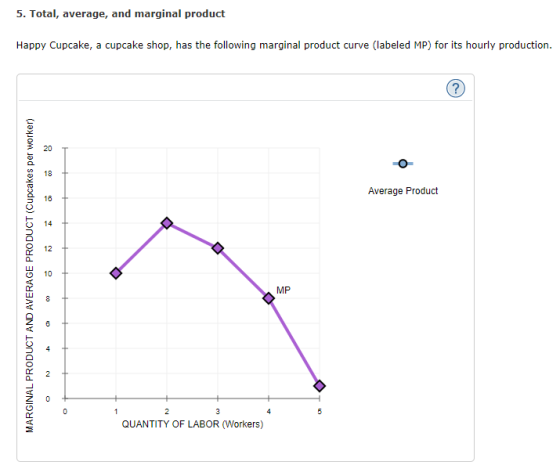
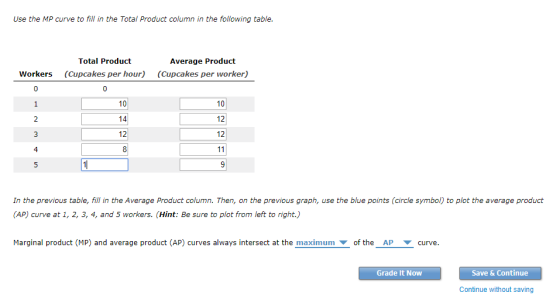
| Workers | Marginal product (Cupcakes per worker) | Total product = summation of MP | Average product =TP/L |
| 0 | - | 0 | - |
| 1 | 10 | 10 | 10 |
| 2 | 14 | (10+14)=24 | 24/2= 12 |
| 3 | 12 | (24+12)= 36 | 36/3= 12 |
| 4 | 8 | (36+8)= 44 | 44/4=11 |
| 5 | 1 | (44+1)=45 | 45/5=9 |
By plotting Average product (AP) ,we get the following graph:

Marginal product (MP) and Average product (AP) curves always intersect at the maximum of the AP curve (as we can see in the graph that MP=AP at 12 when L=3).
Add Answer to:
PLEASE ANSWER QUESTIONS CAREFULLY & ANSWERS MUST BE CLEAR TO
READ! THANKS!
5. Total, average, and...
5. Total, average, and marginal product Underground Sandwiches, a sandwich shop, has the following marginal product...
 5. Total, average, and marginal product Underground Sandwiches, a sandwich shop, has the following marginal product curve (labeled MP) for its daily production. 20 a 18 Average Product 16 14 O 12 MP QUANTITY OF LABOR (Workers) Use the MP curve to fill in the Total Product column in the following table. Total Product Average Product (Sandwiches per worker) Workers (Sandwiches per hour) 3 4 In the previous table, fill in the Average Product column. Then, on the previous graph,...
Total, average, and marginal physical product
4. Total, average, and marginal physical productUndercover World, a book shop, has the following marginal physical product curve (labeled MPPMPP) for its hourly production.AP01234520181614121086420MPP and AP (Books per hour)QUANTITY OF LABORMPPWhen labor increases from three to four workers, total product increases by per hour.Use the orange points (square symbol) to plot the total physical product curve (TPP) on the following graph. Line segments will automatically connect the points. Assume that if there are no workers, Undercover World does not have any...
3. Total, average, and marginal physical product Undercover World, a book shop, has the following marginal...
 3. Total, average, and marginal physical product Undercover World, a book shop, has the following marginal physical product curve (labeled MPP) for its hourly production. 20 T 18 AP 16 O 14 12T a 10 MPP。 4 QUANTITY OF LABOR When labor increases from four to five workers, total product increases by ▼ per hour. Use the orange points (square symbol) to plot the total physical product curve (TPP) on the following graph. Line segments ill automatically connect the points....
PLEASE READ CAREFULLY AND ANSWERS MUST BE CLEAR TO READ! FOR THE ORANGE POINTS PLEASE LIST...
 PLEASE READ CAREFULLY AND ANSWERS MUST BE CLEAR TO READ!
FOR THE ORANGE POINTS PLEASE LIST ALL THE POINTS!
THANKS!!
We were unable to transcribe this imageAndrew's daily production schedule is presented in the following table. Fill in the blanks to complete the Marginal Product of Labor column for each worker. Output Marginal Product of Labor Number of Workers (Pizzas) (Pizzas) 60 100 130 60 40 30 120 10 2 4 160 We were unable to transcribe this imageSuppose that...
PLEASE READ CAREFULLY AND ANSWERS MUST BE CLEAR TO READ!
FOR THE ORANGE POINTS PLEASE LIST ALL THE POINTS!
THANKS!!
We were unable to transcribe this imageAndrew's daily production schedule is presented in the following table. Fill in the blanks to complete the Marginal Product of Labor column for each worker. Output Marginal Product of Labor Number of Workers (Pizzas) (Pizzas) 60 100 130 60 40 30 120 10 2 4 160 We were unable to transcribe this imageSuppose that...
PLEASE READ CAREFULLY AND ANSWER ALL THE QUESTIONS! SHOW ALL YOUR CALCULATIONS CLEARLY! ANSWERS MUST BE...
 PLEASE READ CAREFULLY AND ANSWER ALL THE QUESTIONS! SHOW ALL
YOUR CALCULATIONS CLEARLY! ANSWERS MUST BE CLEAR TO READ!
THANKS!
We were unable to transcribe this imageFill in the blanks to complete the Marginal Product of Labor column for each worker. Output Marginal Product of Labor Number of Workers (Pizzas) (Pizzas) 50 り() 120 140 50 40 30 20 10 2 4 5 150 On the following graph, plot Hubert's production function using the green points (triangle symbol). Note: Plot...
PLEASE READ CAREFULLY AND ANSWER ALL THE QUESTIONS! SHOW ALL
YOUR CALCULATIONS CLEARLY! ANSWERS MUST BE CLEAR TO READ!
THANKS!
We were unable to transcribe this imageFill in the blanks to complete the Marginal Product of Labor column for each worker. Output Marginal Product of Labor Number of Workers (Pizzas) (Pizzas) 50 り() 120 140 50 40 30 20 10 2 4 5 150 On the following graph, plot Hubert's production function using the green points (triangle symbol). Note: Plot...
Topic 4 Homework (Custom) Workers Total Cost Marginal Cost Average Total Cost Output Marginal Product 0...
 Topic 4 Homework (Custom) Workers Total Cost Marginal Cost Average Total Cost Output Marginal Product 0 30 10.00 70 $300 $420 6.00 4.50 $540 120.00 - Nmin 120.00 220 230 $660 $780 $900 $1,020 120.00 120.00 A worker costs $120 a day, and the firm has fixed costs of $180. Use this information to fill in the column for total cost in the previous Fill in the column for marginal cost in the previous table. (Hint: able. (Hint: MC -...
Underground Sandwiches, a sandwich shop, has the following marginal physical product curve (labeled MPPMPP) for its...
Underground Sandwiches, a sandwich shop, has the following marginal physical product curve (labeled MPPMPP) for its hourly production. AP01234520181614121086420MPP and AP (Sandwiches per hour)QUANTITY OF LABORMPP When labor increases from two to three workers, total product increases by per hour. Use the orange points (square symbol) to plot the total physical product curve (TPP) on the following graph. Line segments will automatically connect the points. Assume that if there are no workers, Underground Sandwiches does not have any output, so...
PLEASE ANSWER QUESTIONS CORRECTLY AND ANSWERS MUST BE CLEAR TO READ!!! THANKS!!!! 7. Cost-curve shifters The...
 PLEASE ANSWER QUESTIONS CORRECTLY AND ANSWERS MUST BE CLEAR TO
READ!!! THANKS!!!!
7. Cost-curve shifters The following graph shows the average total cost (ATC) curve, average variable cost (AVC) curve, and average fixed cost (AFC) curve for Kyoko's Pizza Parlor when the retail price Kyoko pays for pizza dough, including sales tax, is $5 per large pizza. AVC 0: AFC OUTPUT (Pizzas per day) Suppose the sales tax on pizza dough is removed, so the price of pizza dough decreases...
PLEASE ANSWER QUESTIONS CORRECTLY AND ANSWERS MUST BE CLEAR TO
READ!!! THANKS!!!!
7. Cost-curve shifters The following graph shows the average total cost (ATC) curve, average variable cost (AVC) curve, and average fixed cost (AFC) curve for Kyoko's Pizza Parlor when the retail price Kyoko pays for pizza dough, including sales tax, is $5 per large pizza. AVC 0: AFC OUTPUT (Pizzas per day) Suppose the sales tax on pizza dough is removed, so the price of pizza dough decreases...
PLEASE ANSWER ALL THE QUESTIONS & ANSWERS MUST BE CLEAR TO READ! THANKS! The following graph...
 PLEASE ANSWER ALL THE QUESTIONS & ANSWERS MUST BE CLEAR TO
READ! THANKS!
The following graph shows the short-run average total cost curves and the long-run average total cost curve for a publishing firm. The five ma quantities indicate points of tangency between each short-run average total cost curve (ATC) and the long-run average total cost curve (LRA for example, Q1 marks the point of tangency between ATC1 and LRATC. The orange point on ATC1 indicates the firm's current output...
PLEASE ANSWER ALL THE QUESTIONS & ANSWERS MUST BE CLEAR TO
READ! THANKS!
The following graph shows the short-run average total cost curves and the long-run average total cost curve for a publishing firm. The five ma quantities indicate points of tangency between each short-run average total cost curve (ATC) and the long-run average total cost curve (LRA for example, Q1 marks the point of tangency between ATC1 and LRATC. The orange point on ATC1 indicates the firm's current output...
3. Total and marginal product Underground Sandwiches, a sandwich shop, has the following marginal product curve...
 3. Total and marginal product Underground Sandwiches, a sandwich shop, has the following marginal product curve (labeled MP) for its hourly production. MARGINAL PRODUCT (Sandwiches per worker LABOR (Workers) When Iwbor increases from three to four workers, total product increases there are no workers Underground Use the orange points (ware symbol) to ple the production function on the following graph. Assume that Sandwiches does not have any output. Note: Plot your points in the order in which you would like...
 5. Total, average, and marginal product Underground Sandwiches, a sandwich shop, has the following marginal product curve (labeled MP) for its daily production. 20 a 18 Average Product 16 14 O 12 MP QUANTITY OF LABOR (Workers) Use the MP curve to fill in the Total Product column in the following table. Total Product Average Product (Sandwiches per worker) Workers (Sandwiches per hour) 3 4 In the previous table, fill in the Average Product column. Then, on the previous graph,...
 3. Total, average, and marginal physical product Undercover World, a book shop, has the following marginal physical product curve (labeled MPP) for its hourly production. 20 T 18 AP 16 O 14 12T a 10 MPP。 4 QUANTITY OF LABOR When labor increases from four to five workers, total product increases by ▼ per hour. Use the orange points (square symbol) to plot the total physical product curve (TPP) on the following graph. Line segments ill automatically connect the points....
 PLEASE READ CAREFULLY AND ANSWERS MUST BE CLEAR TO READ!
FOR THE ORANGE POINTS PLEASE LIST ALL THE POINTS!
THANKS!!
We were unable to transcribe this imageAndrew's daily production schedule is presented in the following table. Fill in the blanks to complete the Marginal Product of Labor column for each worker. Output Marginal Product of Labor Number of Workers (Pizzas) (Pizzas) 60 100 130 60 40 30 120 10 2 4 160 We were unable to transcribe this imageSuppose that...
PLEASE READ CAREFULLY AND ANSWERS MUST BE CLEAR TO READ!
FOR THE ORANGE POINTS PLEASE LIST ALL THE POINTS!
THANKS!!
We were unable to transcribe this imageAndrew's daily production schedule is presented in the following table. Fill in the blanks to complete the Marginal Product of Labor column for each worker. Output Marginal Product of Labor Number of Workers (Pizzas) (Pizzas) 60 100 130 60 40 30 120 10 2 4 160 We were unable to transcribe this imageSuppose that...
 PLEASE READ CAREFULLY AND ANSWER ALL THE QUESTIONS! SHOW ALL
YOUR CALCULATIONS CLEARLY! ANSWERS MUST BE CLEAR TO READ!
THANKS!
We were unable to transcribe this imageFill in the blanks to complete the Marginal Product of Labor column for each worker. Output Marginal Product of Labor Number of Workers (Pizzas) (Pizzas) 50 り() 120 140 50 40 30 20 10 2 4 5 150 On the following graph, plot Hubert's production function using the green points (triangle symbol). Note: Plot...
PLEASE READ CAREFULLY AND ANSWER ALL THE QUESTIONS! SHOW ALL
YOUR CALCULATIONS CLEARLY! ANSWERS MUST BE CLEAR TO READ!
THANKS!
We were unable to transcribe this imageFill in the blanks to complete the Marginal Product of Labor column for each worker. Output Marginal Product of Labor Number of Workers (Pizzas) (Pizzas) 50 り() 120 140 50 40 30 20 10 2 4 5 150 On the following graph, plot Hubert's production function using the green points (triangle symbol). Note: Plot...
 Topic 4 Homework (Custom) Workers Total Cost Marginal Cost Average Total Cost Output Marginal Product 0 30 10.00 70 $300 $420 6.00 4.50 $540 120.00 - Nmin 120.00 220 230 $660 $780 $900 $1,020 120.00 120.00 A worker costs $120 a day, and the firm has fixed costs of $180. Use this information to fill in the column for total cost in the previous Fill in the column for marginal cost in the previous table. (Hint: able. (Hint: MC -...
 PLEASE ANSWER QUESTIONS CORRECTLY AND ANSWERS MUST BE CLEAR TO
READ!!! THANKS!!!!
7. Cost-curve shifters The following graph shows the average total cost (ATC) curve, average variable cost (AVC) curve, and average fixed cost (AFC) curve for Kyoko's Pizza Parlor when the retail price Kyoko pays for pizza dough, including sales tax, is $5 per large pizza. AVC 0: AFC OUTPUT (Pizzas per day) Suppose the sales tax on pizza dough is removed, so the price of pizza dough decreases...
PLEASE ANSWER QUESTIONS CORRECTLY AND ANSWERS MUST BE CLEAR TO
READ!!! THANKS!!!!
7. Cost-curve shifters The following graph shows the average total cost (ATC) curve, average variable cost (AVC) curve, and average fixed cost (AFC) curve for Kyoko's Pizza Parlor when the retail price Kyoko pays for pizza dough, including sales tax, is $5 per large pizza. AVC 0: AFC OUTPUT (Pizzas per day) Suppose the sales tax on pizza dough is removed, so the price of pizza dough decreases...
 PLEASE ANSWER ALL THE QUESTIONS & ANSWERS MUST BE CLEAR TO
READ! THANKS!
The following graph shows the short-run average total cost curves and the long-run average total cost curve for a publishing firm. The five ma quantities indicate points of tangency between each short-run average total cost curve (ATC) and the long-run average total cost curve (LRA for example, Q1 marks the point of tangency between ATC1 and LRATC. The orange point on ATC1 indicates the firm's current output...
PLEASE ANSWER ALL THE QUESTIONS & ANSWERS MUST BE CLEAR TO
READ! THANKS!
The following graph shows the short-run average total cost curves and the long-run average total cost curve for a publishing firm. The five ma quantities indicate points of tangency between each short-run average total cost curve (ATC) and the long-run average total cost curve (LRA for example, Q1 marks the point of tangency between ATC1 and LRATC. The orange point on ATC1 indicates the firm's current output...
 3. Total and marginal product Underground Sandwiches, a sandwich shop, has the following marginal product curve (labeled MP) for its hourly production. MARGINAL PRODUCT (Sandwiches per worker LABOR (Workers) When Iwbor increases from three to four workers, total product increases there are no workers Underground Use the orange points (ware symbol) to ple the production function on the following graph. Assume that Sandwiches does not have any output. Note: Plot your points in the order in which you would like...
Most questions answered within 3 hours.
-
What are John’s potential claims if he is terminated
this week?
John is a 54-year-old man...
asked 29 seconds ago -
A (8.5) cm tall object is placed at a distance of (14.2) cm from
a convex...
asked 8 minutes ago -
(2) For the following questions, consider a data set that
exhibits a normal distribution. Report the...
asked 9 minutes ago -
What exactly is an information system? How does it work" What
are its people organization,
...
asked 11 minutes ago -
The Food Marketing Institute shows that 17% of households spend
more than $100 per week on...
asked 20 minutes ago -
Go to NCBI BLAST search web page
1st search: GEKDLRRAKDINQEVYNF
2nd search: PTSQRLQLLEPFDK
3rd search: GEKDLRRAKDINQEVYNF...
asked 24 minutes ago -
Explain how each of the following three conditions could be a
red flag for a register...
asked 29 minutes ago -
In a two-way factorial ANOVA, the final F-ratio for
factor AxB is determined by dividing _____...
asked 59 minutes ago -
Show your solutions for answer.
4. An aqueous solution contains 9.21 g of
K4Fe(CN)6 in a...
asked 29 minutes ago -
The random variable X has a uniform distribution with values
between 16 and 18. What is...
asked 39 minutes ago -
Evaluate each of the following transactions in terms of their
effect on assets, liabilities, and equity....
asked 37 minutes ago -
The amounts of nicotine in a certain brand of cigarette are
normally distributed with a mean...
asked 58 minutes ago