
Please answer(calculations) the above questions through formulas and explain if possible. Please refrain from using Excel functions . Thanks.
In (c) there is no need to calculate the jensen alpha. sorry. only the sharpe ratio is needed.
Homework Answers
Part (a)

= 60% x 0.75 + 40% x 0.7 = 0.73

=[(0.6 x 0.2)2 + (0.4 x 0.4)2 + 2 x 0.6 x 0.4 x (-0.35) x 0.2 x 0.4]1/2 = 0.1630
Part (b)
Efficiency ratio: Not sure what efficiency ratio are you looking for. For any other ratio other than Sharpe ratio, we need beta which is not there. So, am really not able to answer this. Please don't down rate the answer because of this.
Part (c)
Sharpe Ratio = (R - Rf) / Std deviation
Hence, Sharpe Ratio of X = (0.75 - 2%) / 0.2 = 3.65
Hence, Sharpe Ratio of Y = (0.7 - 2%) / 0.4 = 1.70
Part (d)
Minimum variance portfolio
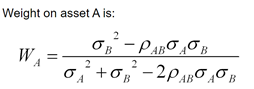
In the formula above, A = X and B = Y
Hence, weight of X = [0.42 - (-0.35) x 0.4 x 0.2] / [0.22 + 0.42 - 2 x (-0.35) x 0.4 x 0.2] = 0.7344 = 73.44%
and weight of Y = 1 - weight of X = 1 - 0.7344 =
0.2656 = 26.56%
Add Answer to:
Please answer(calculations) the above questions
through formulas and explain if possible. Please refrain from using
Excel...
Show all of your work and answer all questions in Excel. The questions should look familiar....
 Show all of your work and answer all questions in Excel. The questions should look familiar. Each question is 15 points. Historic Returns X returns Bret 1. Draw the opportunity set of securities X and B. Be sure to label the minimum-variance portfolio, the optimal portfolio, and the capital allocation line B returns T-Bills 4.15 -7 37 2. Find the optimal risky portfolio (O), its expected return, standard deviation, and Sharpe ratio. Compare with the Sharpe ratios of X and...
Answer all questions and show work using hand formulas only. Do NOT answer the question if...
 Answer all questions and show work using hand formulas only. Do
NOT answer the question if you cannot answer everything.
1.
2.
3.
TABLE 5.3 Risk and return of investments in major asset classes, 1927-2016 T-bills T-bonds Stocks Arithmetic average Risk premium Standard deviation max min 3.42 N/A 3.14 14.71 -0.02 5.51 2.08 8.14 38.07 -8.47 11.91 8.48 19.99 56.38 -43.73 Using Table 5.3 as your guide, what is your estimate of the expected annual HPR on the market index...
Answer all questions and show work using hand formulas only. Do
NOT answer the question if you cannot answer everything.
1.
2.
3.
TABLE 5.3 Risk and return of investments in major asset classes, 1927-2016 T-bills T-bonds Stocks Arithmetic average Risk premium Standard deviation max min 3.42 N/A 3.14 14.71 -0.02 5.51 2.08 8.14 38.07 -8.47 11.91 8.48 19.99 56.38 -43.73 Using Table 5.3 as your guide, what is your estimate of the expected annual HPR on the market index...
Please solve question 2 and 3 below 2. Discuss how the investor can use the separation...
 Please solve question 2 and 3 below
2. Discuss how the investor can use the separation theorem and utility theory to produce an efficient portfolio suitable for the investor's level of risk tolerance. 3. Two risky assets with returns r1, r2 and standard deviations 01, 02, and correlation p. Calculate the weights for the following two optimal portfolios. a. Minimum volatility (variance) portfolio minimizes the overall risk mino, s.t. W + W2 = 1 b. Maximum Sharpe Ratio portfolio delivers...
Please solve question 2 and 3 below
2. Discuss how the investor can use the separation theorem and utility theory to produce an efficient portfolio suitable for the investor's level of risk tolerance. 3. Two risky assets with returns r1, r2 and standard deviations 01, 02, and correlation p. Calculate the weights for the following two optimal portfolios. a. Minimum volatility (variance) portfolio minimizes the overall risk mino, s.t. W + W2 = 1 b. Maximum Sharpe Ratio portfolio delivers...
Section B: Short Answer Questions 1. Discuss why common stocks must earn a risk premium. 2....
 Section B: Short Answer Questions 1. Discuss why common stocks must earn a risk premium. 2. Discuss how the investor can use the separation theorem and utility theory to produce an efficient portfolio suitable for the investor's level of risk tolerance. 3. Two risky assets with returns ri, r, and standard deviations 01, 02, and correlation p. Calculate the weights for the following two optimal portfolios. a. Minimum volatility (variance) portfolio minimizes the overall risk min 0, s.t. W, +...
Show workings and answer to 3 decimal places thank you! To the person who answered this...
 Show workings and answer to 3 decimal places thank you!
To the person who answered this question before. Dont :)
Given the following information, please address the following questions. Expected Sharpe return Std. Dev ratio Stock A 0.230 0.350 0.514 Stock B 0.120 0.250 0.280 Risk-free Rate 0.050 Optimal Portfolio O (Comprised of comprised of 57% investment in Stock A and the remaining in Stock 0.227 0.586 Correlation Between Stock A and B = If you want to use risky...
Show workings and answer to 3 decimal places thank you!
To the person who answered this question before. Dont :)
Given the following information, please address the following questions. Expected Sharpe return Std. Dev ratio Stock A 0.230 0.350 0.514 Stock B 0.120 0.250 0.280 Risk-free Rate 0.050 Optimal Portfolio O (Comprised of comprised of 57% investment in Stock A and the remaining in Stock 0.227 0.586 Correlation Between Stock A and B = If you want to use risky...
Consider the data in the table below and answer the following questions: Utility Score Portfolio L...
 Consider the data in the table below and answer the following questions: Utility Score Portfolio L Utility Score Portfolio M Utility Score Portfolio H Investor Risk Aversion (A) Er) =.07: =.05 E(r)=.09: O= E(r)= 13: o = 2 13-4x2x.22 =.0900 107 _x2x.052 = .0675.09–5x2x. P = 0800 <3<.05º =.0663.00 – £x3x8 =.0750 13-_x3x.2° = 0700 2X4x.052 - 0650.09 -->x4x. 1° = -0700 13x4x.22 - 0500 1. The three risk aversion coefficients in the first column represent investors X, Y and...
Please show excel calculations, no handwritten answer. A pension fund manager is considering three mutual funds....
 Please show excel calculations, no
handwritten answer.
A pension fund manager is considering three mutual funds. The first is a stock fund, the second is a long-term government and corporate bond fund, and the third is a T-bill money market fund that yields a rate of 8%. The probability distribution of the risky funds is as follows: Expected Return 22% 12 Standard Deviation 38% 16 Stock fund (S) Bond fund (B) The correlation between the fund returns is 0.10. a-1....
Please show excel calculations, no
handwritten answer.
A pension fund manager is considering three mutual funds. The first is a stock fund, the second is a long-term government and corporate bond fund, and the third is a T-bill money market fund that yields a rate of 8%. The probability distribution of the risky funds is as follows: Expected Return 22% 12 Standard Deviation 38% 16 Stock fund (S) Bond fund (B) The correlation between the fund returns is 0.10. a-1....
Question 31 6.5 p Given the following information, please address the following question. Expected Sharpe return...
 Question 31 6.5 p Given the following information, please address the following question. Expected Sharpe return Std. Dev ratio Stock A 0.210 0.390 0.410 Stock B 0.140 0.200 0.450 Risk free rate 0.050 Optimal Portfolio O Comprised of comprised of 32% investment in Stock 0.162 A and the remaining in Stock B 0.185 0.609 Correlation Between Stock A and B = 0 If you want to use risky assets and the risky free T-bill to construct an efficient portfolio D...
Please show all work. Thanks! An optimal risky portfolio has been developed with investments in stocks...
 Please show all work. Thanks!
An optimal risky portfolio has been developed with investments in stocks and bonds This optimal portfolio has 24% invested in bonds and the remainder invested in stocks The optimal portfolio mean return is 12.05% and its standard deviation is 18.45% The t-bill rate is 4.75%; what is the mean of the complete portfolio if 33% is invested in the optimal portfolio and theremainder is invested in T-bills? a What is the resulting allocation to stocks...
Please show all work. Thanks!
An optimal risky portfolio has been developed with investments in stocks and bonds This optimal portfolio has 24% invested in bonds and the remainder invested in stocks The optimal portfolio mean return is 12.05% and its standard deviation is 18.45% The t-bill rate is 4.75%; what is the mean of the complete portfolio if 33% is invested in the optimal portfolio and theremainder is invested in T-bills? a What is the resulting allocation to stocks...
Please answer the questions above. Thank you! You manage an index fund that is an exact...
 Please answer the questions above. Thank you!
You manage an index fund that is an exact replica of the market index. The market expected annual rate of return is 19.5% with a standard deviation of 16.5%. Annual T-bill rate is 4.5% 2. a. A client of yours wants you to invest 80% of his portfolio in your fund and 20 % in T-bill money market fund. What is the expected return and standard deviation of this client's portfolio? b. What...
Please answer the questions above. Thank you!
You manage an index fund that is an exact replica of the market index. The market expected annual rate of return is 19.5% with a standard deviation of 16.5%. Annual T-bill rate is 4.5% 2. a. A client of yours wants you to invest 80% of his portfolio in your fund and 20 % in T-bill money market fund. What is the expected return and standard deviation of this client's portfolio? b. What...
 Show all of your work and answer all questions in Excel. The questions should look familiar. Each question is 15 points. Historic Returns X returns Bret 1. Draw the opportunity set of securities X and B. Be sure to label the minimum-variance portfolio, the optimal portfolio, and the capital allocation line B returns T-Bills 4.15 -7 37 2. Find the optimal risky portfolio (O), its expected return, standard deviation, and Sharpe ratio. Compare with the Sharpe ratios of X and...
 Answer all questions and show work using hand formulas only. Do
NOT answer the question if you cannot answer everything.
1.
2.
3.
TABLE 5.3 Risk and return of investments in major asset classes, 1927-2016 T-bills T-bonds Stocks Arithmetic average Risk premium Standard deviation max min 3.42 N/A 3.14 14.71 -0.02 5.51 2.08 8.14 38.07 -8.47 11.91 8.48 19.99 56.38 -43.73 Using Table 5.3 as your guide, what is your estimate of the expected annual HPR on the market index...
Answer all questions and show work using hand formulas only. Do
NOT answer the question if you cannot answer everything.
1.
2.
3.
TABLE 5.3 Risk and return of investments in major asset classes, 1927-2016 T-bills T-bonds Stocks Arithmetic average Risk premium Standard deviation max min 3.42 N/A 3.14 14.71 -0.02 5.51 2.08 8.14 38.07 -8.47 11.91 8.48 19.99 56.38 -43.73 Using Table 5.3 as your guide, what is your estimate of the expected annual HPR on the market index...
 Please solve question 2 and 3 below
2. Discuss how the investor can use the separation theorem and utility theory to produce an efficient portfolio suitable for the investor's level of risk tolerance. 3. Two risky assets with returns r1, r2 and standard deviations 01, 02, and correlation p. Calculate the weights for the following two optimal portfolios. a. Minimum volatility (variance) portfolio minimizes the overall risk mino, s.t. W + W2 = 1 b. Maximum Sharpe Ratio portfolio delivers...
Please solve question 2 and 3 below
2. Discuss how the investor can use the separation theorem and utility theory to produce an efficient portfolio suitable for the investor's level of risk tolerance. 3. Two risky assets with returns r1, r2 and standard deviations 01, 02, and correlation p. Calculate the weights for the following two optimal portfolios. a. Minimum volatility (variance) portfolio minimizes the overall risk mino, s.t. W + W2 = 1 b. Maximum Sharpe Ratio portfolio delivers...
 Section B: Short Answer Questions 1. Discuss why common stocks must earn a risk premium. 2. Discuss how the investor can use the separation theorem and utility theory to produce an efficient portfolio suitable for the investor's level of risk tolerance. 3. Two risky assets with returns ri, r, and standard deviations 01, 02, and correlation p. Calculate the weights for the following two optimal portfolios. a. Minimum volatility (variance) portfolio minimizes the overall risk min 0, s.t. W, +...
 Show workings and answer to 3 decimal places thank you!
To the person who answered this question before. Dont :)
Given the following information, please address the following questions. Expected Sharpe return Std. Dev ratio Stock A 0.230 0.350 0.514 Stock B 0.120 0.250 0.280 Risk-free Rate 0.050 Optimal Portfolio O (Comprised of comprised of 57% investment in Stock A and the remaining in Stock 0.227 0.586 Correlation Between Stock A and B = If you want to use risky...
Show workings and answer to 3 decimal places thank you!
To the person who answered this question before. Dont :)
Given the following information, please address the following questions. Expected Sharpe return Std. Dev ratio Stock A 0.230 0.350 0.514 Stock B 0.120 0.250 0.280 Risk-free Rate 0.050 Optimal Portfolio O (Comprised of comprised of 57% investment in Stock A and the remaining in Stock 0.227 0.586 Correlation Between Stock A and B = If you want to use risky...
 Consider the data in the table below and answer the following questions: Utility Score Portfolio L Utility Score Portfolio M Utility Score Portfolio H Investor Risk Aversion (A) Er) =.07: =.05 E(r)=.09: O= E(r)= 13: o = 2 13-4x2x.22 =.0900 107 _x2x.052 = .0675.09–5x2x. P = 0800 <3<.05º =.0663.00 – £x3x8 =.0750 13-_x3x.2° = 0700 2X4x.052 - 0650.09 -->x4x. 1° = -0700 13x4x.22 - 0500 1. The three risk aversion coefficients in the first column represent investors X, Y and...
 Please show excel calculations, no
handwritten answer.
A pension fund manager is considering three mutual funds. The first is a stock fund, the second is a long-term government and corporate bond fund, and the third is a T-bill money market fund that yields a rate of 8%. The probability distribution of the risky funds is as follows: Expected Return 22% 12 Standard Deviation 38% 16 Stock fund (S) Bond fund (B) The correlation between the fund returns is 0.10. a-1....
Please show excel calculations, no
handwritten answer.
A pension fund manager is considering three mutual funds. The first is a stock fund, the second is a long-term government and corporate bond fund, and the third is a T-bill money market fund that yields a rate of 8%. The probability distribution of the risky funds is as follows: Expected Return 22% 12 Standard Deviation 38% 16 Stock fund (S) Bond fund (B) The correlation between the fund returns is 0.10. a-1....
 Question 31 6.5 p Given the following information, please address the following question. Expected Sharpe return Std. Dev ratio Stock A 0.210 0.390 0.410 Stock B 0.140 0.200 0.450 Risk free rate 0.050 Optimal Portfolio O Comprised of comprised of 32% investment in Stock 0.162 A and the remaining in Stock B 0.185 0.609 Correlation Between Stock A and B = 0 If you want to use risky assets and the risky free T-bill to construct an efficient portfolio D...
 Please show all work. Thanks!
An optimal risky portfolio has been developed with investments in stocks and bonds This optimal portfolio has 24% invested in bonds and the remainder invested in stocks The optimal portfolio mean return is 12.05% and its standard deviation is 18.45% The t-bill rate is 4.75%; what is the mean of the complete portfolio if 33% is invested in the optimal portfolio and theremainder is invested in T-bills? a What is the resulting allocation to stocks...
Please show all work. Thanks!
An optimal risky portfolio has been developed with investments in stocks and bonds This optimal portfolio has 24% invested in bonds and the remainder invested in stocks The optimal portfolio mean return is 12.05% and its standard deviation is 18.45% The t-bill rate is 4.75%; what is the mean of the complete portfolio if 33% is invested in the optimal portfolio and theremainder is invested in T-bills? a What is the resulting allocation to stocks...
 Please answer the questions above. Thank you!
You manage an index fund that is an exact replica of the market index. The market expected annual rate of return is 19.5% with a standard deviation of 16.5%. Annual T-bill rate is 4.5% 2. a. A client of yours wants you to invest 80% of his portfolio in your fund and 20 % in T-bill money market fund. What is the expected return and standard deviation of this client's portfolio? b. What...
Please answer the questions above. Thank you!
You manage an index fund that is an exact replica of the market index. The market expected annual rate of return is 19.5% with a standard deviation of 16.5%. Annual T-bill rate is 4.5% 2. a. A client of yours wants you to invest 80% of his portfolio in your fund and 20 % in T-bill money market fund. What is the expected return and standard deviation of this client's portfolio? b. What...
Most questions answered within 3 hours.
-
Focus on Critical Thinking: Are citizen suit provisions an
effective way to achieve environmental objectives? Do...
asked 17 minutes ago -
Gaseous butane CH3CH22CH3 will react with gaseous oxygen O2 to
produce gaseous carbon dioxide CO2 and...
asked 42 minutes ago -
Required to construct counters using synchronous sequential
logic. Use one hex digit to display the result....
asked 52 minutes ago -
(Ultra) Large-Scale Systems –Characteristics?
explain in detail
How the nature of an enterprise affect complex...
asked 1 hour ago -
Some of the antibiotic susceptible strains show colonies within
the clear zone. What it does this...
asked 1 hour ago -
In the lottery game Fantasy 5 you have to select 5 numbers from
the numbers {1,2,3,.......,38,39}....
asked 1 hour ago -
A call option on Jupiter Motors stock with an exercise price of
$80 and one-year expiration...
asked 1 hour ago -
What is the disadvantage of an automated vulnerability scan tool
like Nessus?
prone to false negatives...
asked 1 hour ago -
An Atwood’s machine has m1 = 0.105 kg, m2 = 0.100 kg, hung from
a 5.00...
asked 1 hour ago -
A firm is considering a project that has the following estimated
cashflows:
Increased sales to business...
asked 1 hour ago -
Programming logic C# visual studio
What are the values of the double variable x after each...
asked 1 hour ago -
A bag has 8 red marbles, 6 green marbles, 4 blue marbles, and 2
yellow marbles....
asked 1 hour ago