The per capita disposable income for residents of a U.S. city in a recent year is...
The per capita disposable income for residents of a U.S. city in a recent year is normally distributed, with a mean of about $44,000 and a standard deviation of about $2450. Use this information in Exercises 7-10.
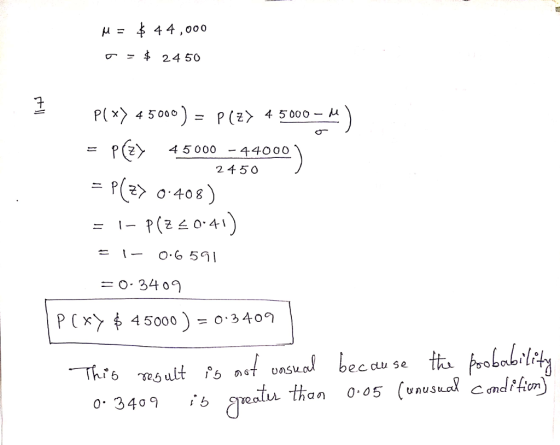
7. Find the probability that the disposable income of a resident is more than $45,000. Is this an unusual event? Explain.
8. Out of 800 residents, about how many would you expect to have a disposable income of between $40,000 and $42,000?
9. Between what two values does the middle 60% of disposable incomes lie?
10. Random samples of size 8 are drawn from the population and the mean of each sample is determined. Is the sampling distribution of sample means normally distributed? Explain.
Homework Answers


Add Answer to:
The per capita disposable income for residents of a U.S. city in
a recent year is...
2.) In a recent year, Delaware had the highest per capita annual income with an average...
 2.) In a recent year, Delaware had the highest per capita annual income with an average of $51,800 and Annual per capita income is normally distributed in Delaware. $1850. (a) If a resident is randomly selected, what is the probability that their income is less than $50,000? Let X be the salary of a randomly selected Delaware resident. Write an inequality that represents the scenario described in (a). DIX< 50.000)=0.3553 Properly shade the bell, set-up, and solve the problem. m=51,800...
In a recent year, Delaware had the highest per capita annual income with $51,803. If standard...
In a recent year, Delaware had the highest per capita annual income with $51,803. If standard deviation= $4850, what is the probability that a random sample of 36 state residents had a mean income greater than $50,100
In a study of monthly salary distribution of residents in Paris conducted in year 2015, it...
In a study of monthly salary distribution of residents in Paris conducted in year 2015, it was found that the salaries had an average of €2200 (EURO) and a standard deviation of €550. Assume that the salaries were normally distributed. Question 1: Consider sampling with sample size 64 on the above population. Compute the mean of the ̅ sampling distribution of the mean (?). Question 2: Compute the standard deviation of the sampling distribution of the mean in Question 1...
Annual income: The mean annual income for people in a certain city in thousands of dollars)...
 Annual income: The mean annual income for people in a certain city in thousands of dollars) is 41, with a standard deviation of 35. A pollster draws a sample of 91 people to interview. Part 1 of 5 (a) What is the probability that the sample mean income is less than 37? Round the answer to at least four decimal places. The probability that the sample mean income is less than 37 is Part 2 of 5 (b) What is...
Question 1 The following data represent the number of days absent per year in a population...
Question 1 The following data represent the number of days absent per year in a population of four employees of a small company: 1 3 6 7 Assuming that you sample without replacement, select all possible samples of n = 2 and construct the sampling distribution of the mean. Compare the mean of all the samples means and also compute the population mean. Are they equal? What is the property called? Repeat (a) for all the sampling distribution of the...
5.4.1 Question Help A population has a mean = 141 and a standard deviation o =...
 5.4.1 Question Help A population has a mean = 141 and a standard deviation o = 28. Find the mean and standard deviation of the sampling distribution of sample means with sample size n = 40. The mean is :-), and the standard deviation is 0;=0 (Round to three decimal places as needed.) 5.4.2 Question Help A population has a meanu - 74 and a standard deviation = 8. Find the mean and standard deviation of a sampling distribution of...
Suppose 5% of students are veterans and 149 students are involved in sports. How unusual would...
 Suppose 5% of students are veterans and 149 students are involved in sports. How unusual would it be to have no more than 20 veterans involved in sports? (20 veterans is about 13.4228%) When working with samples of size 149, what is the mean of the sampling distribution for the proportion of veterans? 0.01785 Х When working with samples of size 149, what is the standard error of the sampling distribution for the proportion of veterans? Compute PCÔ < 0.134228)....
19% Bookmarks Window Help- rl File Edit View History www.awn.connectmath.com McGr Stadents NSu Merew-HCnpus-...
 19% Bookmarks Window Help- rl File Edit View History www.awn.connectmath.com McGr Stadents NSu Merew-HCnpus-Summer 2019 9 Part 3 of 5 (c) Find the 40th percentile of the sample mean. Round the answer to at least two decimal places. The 40th percentile of the sample mean is $ Part 4 of 5 (d) Would it be unusual if the sample mean were less than $7700? Round answer to at least four decimal places. It (Choose one) unusual because the probability of...
A Waist is a Terrible Thing to Mind: The waist circumference of males 20 to 29...
 A Waist is a Terrible Thing to Mind: The waist circumference of males 20 to 29 years ele is approximately normally distributed, with mean 92.5 cm and standard deviation 13.5 Source: M.A. McDowell. CD. Fryar.R. Hirs for Children and Adults: U.S. Population. 1999-2002. Advance data from vital and health statistics: No. 361. Hyattsville, MD: National Center for Health Statistics, 2005. d CL. Ogden, Anthropometric Reference Data 5. Draw a normal curve with the parameters labeled. 92.5 What proportion of 20-...
7. The data table below provides the same line item data from state budgets in North...
7. The data table below provides the same line item data from state budgets in North Dakota; however, now the data has been adjusted for inflation. All of the data is given in terms of 2003 dollars. Calculate the inflation adjusted per capita expenditure (amount paid per state resident in terms of 2003 dollars) for each of the three given line items (higher education, transportation, and total budget) both in 2003 and again in 2014. Record your answers in the...
 2.) In a recent year, Delaware had the highest per capita annual income with an average of $51,800 and Annual per capita income is normally distributed in Delaware. $1850. (a) If a resident is randomly selected, what is the probability that their income is less than $50,000? Let X be the salary of a randomly selected Delaware resident. Write an inequality that represents the scenario described in (a). DIX< 50.000)=0.3553 Properly shade the bell, set-up, and solve the problem. m=51,800...
 Annual income: The mean annual income for people in a certain city in thousands of dollars) is 41, with a standard deviation of 35. A pollster draws a sample of 91 people to interview. Part 1 of 5 (a) What is the probability that the sample mean income is less than 37? Round the answer to at least four decimal places. The probability that the sample mean income is less than 37 is Part 2 of 5 (b) What is...
 5.4.1 Question Help A population has a mean = 141 and a standard deviation o = 28. Find the mean and standard deviation of the sampling distribution of sample means with sample size n = 40. The mean is :-), and the standard deviation is 0;=0 (Round to three decimal places as needed.) 5.4.2 Question Help A population has a meanu - 74 and a standard deviation = 8. Find the mean and standard deviation of a sampling distribution of...
 Suppose 5% of students are veterans and 149 students are involved in sports. How unusual would it be to have no more than 20 veterans involved in sports? (20 veterans is about 13.4228%) When working with samples of size 149, what is the mean of the sampling distribution for the proportion of veterans? 0.01785 Х When working with samples of size 149, what is the standard error of the sampling distribution for the proportion of veterans? Compute PCÔ < 0.134228)....
 19% Bookmarks Window Help- rl File Edit View History www.awn.connectmath.com McGr Stadents NSu Merew-HCnpus-Summer 2019 9 Part 3 of 5 (c) Find the 40th percentile of the sample mean. Round the answer to at least two decimal places. The 40th percentile of the sample mean is $ Part 4 of 5 (d) Would it be unusual if the sample mean were less than $7700? Round answer to at least four decimal places. It (Choose one) unusual because the probability of...
 A Waist is a Terrible Thing to Mind: The waist circumference of males 20 to 29 years ele is approximately normally distributed, with mean 92.5 cm and standard deviation 13.5 Source: M.A. McDowell. CD. Fryar.R. Hirs for Children and Adults: U.S. Population. 1999-2002. Advance data from vital and health statistics: No. 361. Hyattsville, MD: National Center for Health Statistics, 2005. d CL. Ogden, Anthropometric Reference Data 5. Draw a normal curve with the parameters labeled. 92.5 What proportion of 20-...
Most questions answered within 3 hours.
-
a uniform bar of weight 40N is 4 meter long. weights
on 60N and 100N are...
asked 7 minutes ago -
Problem 2: The Problem of Social Cost. A Rancher and Farmer live
side-by-side to each other....
asked 38 minutes ago -
Define Diet counceling? What are the
responsibilities of a counselor?
asked 2 hours ago -
Hey im just confused about how to put the ' A angle n' and ' S...
asked 2 hours ago -
A short essay about the WSJ article on Oreo versus Hydrox.
asked 2 hours ago -
##8. A program contains the following function definition:
##def cube(num):
##return num * num * num...
asked 2 hours ago -
find the value z of a standard Normal variable that satisfies
each of the given conditions....
asked 2 hours ago -
"banana".find('z')
Out[22]: -1
why is this -1
python 3.7
asked 2 hours ago -
Ilegal Consideration Marna Balin was involved in two automobile
accidents in which she suffered severe injures.She...
asked 2 hours ago -
Walk through the operation of QuickSort when n = 7 and the input
array is A...
asked 2 hours ago -
Answer with True or False. Argue the answers
7) The circulation of field B on any...
asked 2 hours ago -
Chase Co. uses the perpetual inventory method. The inventory
records for Chase reflected the following
Jan...
asked 2 hours ago