
Homework Answers


Add Answer to:
Problem 3: Natural Monopoly Regulation. A natural monopolist faces a demand curve P = 100-Q. The...
Practice Question 4. The inverse demand curve a monopoly faces is p = 30 – Q....
 Practice Question 4. The inverse demand curve a monopoly faces is p = 30 – Q. The firm's total cost function is C(Q) = 0.5Q² and thus marginal cost function is MC(Q) = Q. (a) Determine the monopoly quantity, price and profit, and calculate the CS, PS and social welfare under the monopoly. (b) Determine the socially optimal outcome and calculate the CS, PS and social welfare under the social optimum. (c) Calculate the deadweight loss due to the monopolist...
4. Suppose that a monopoly faces inverse demand given by P = 12-Q and has marginal...
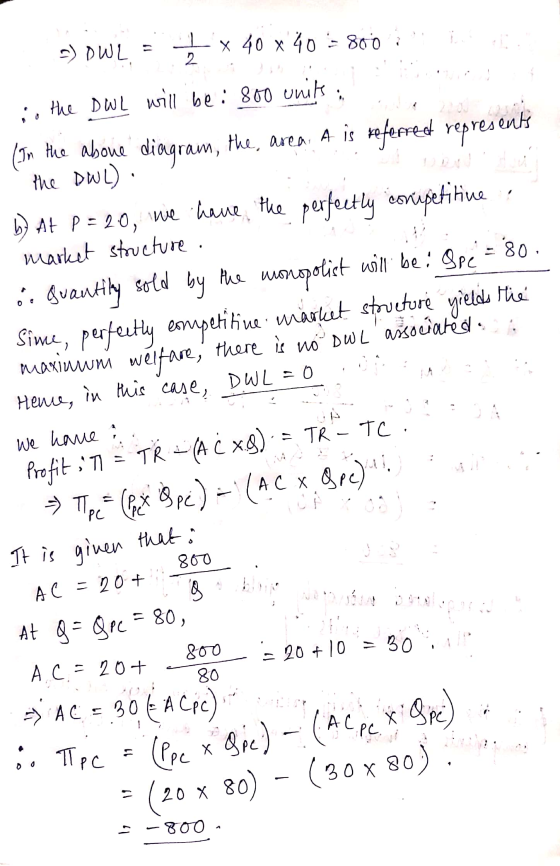
 4. Suppose that a monopoly faces inverse demand given by P = 12-Q and has marginal cost equal to $2. (a) (5 points) Determine the equilibrium price, denoted by P (b) (5 points) If the market was instead served by perfectly competitive firms, then what is the equilibrium price? Denote it by P. (e) (4 points) If the monopolist can charge an entry fee in addition to its price P, then what is the optimal entry fee in this case?...
A monopolist faces a demand curve given by P = 200-10Q
A monopolist faces a demand curve given by P = 200-10Q, where P is the price of the good and Q is the quantity demanded. The marginal cost of production is constant and is equal to $60. There are no fixed costs of production.A) What quantity should the monopolist produce in order to maximize profit?B) What price should the monopolist charge in order to maximize profit?C) How much profit will the monopolist make?D) What is the deadweight loss created by this monopoly...
Question 3 A monopolist faces a demand curve given by P = 105 - 30 where...
 Question 3 A monopolist faces a demand curve given by P = 105 - 30 where P is the price of the good and Q is the quantity demanded. The marginal cost of production is constant and is equal to $15. There are no fixed costs of production. Hint: To answer the following questions, it may be helpful to draw a graph! What quantity should the monopolist produce in order to maximize profit? What price should the monopolist charge in...
5. A monopolist faces a demand curve P = 60 – 2Q and initially faces a...
 5. A monopolist faces a demand curve P = 60 – 2Q and initially faces a constant marginal cost MC = 4. (a) Calculate the profit-maximizing monopoly quantity and price, and compute the monopolist's total rev- enue and profits at the optimal price. (b) Suppose that the monopolist's marginal cost in- creases to MC = 8. Verify that the monopolist's total revenue goes down. (c) Suppose that all firms in a perfectly competitive equilibrium had a constant marginal cost MC...
A monopolist faces a demand curve P = 210 - 3Q and faces a constant marginal cost MC = 15.
A monopolist faces a demand curve P = 210 - 3Q and faces a constant marginal cost MC = 15. a) Calculate the profit-maximizing monopoly quantity and compute the monopolist's total revenue at the optimal price. d) Suppose that this monopoly opens for competition and the market becomes perfectly competitive. The firms face constant marginal cost MC = 15. Find the long-run perfectly competitive industry price and quantity.
1. (25 points) Suppose that a monopolist faces the inverse demand curve: P 100-Q and produces goods at a marginal c...
 1. (25 points) Suppose that a monopolist faces the inverse demand curve: P 100-Q and produces goods at a marginal cost of $5. Finally assume that the firm incurs no fixed costs A. Suppose the monopolist lowers the price from $90 to $89. Explain why the firm's marginal revenue is less than the price of the 11th unit sold, $89 (do not answer this question by providing a mathematical equation). B. At what price will the monopolist maximize its profit?...
Consider the local telephone company, a natural monopoly. The following graph shows the demand curve for...
 Consider the local telephone company, a natural monopoly. The following graph shows the demand curve for phone services, the company's marginal revenue curve (labeled MR), its marginal cost curve (labeled MC), and its average total cost curve (labeled ATC). You can hover over the points on the graph to see their exact coordinates. PRICE, COST, MR (Dollars per month) 100 90 80 70 60 Demand 50 40 30 ATC 20 MC 10 MR 54 60 30 36 42 48 0...
Figure 15-6 Price $20+ Marginal Cost 100 150 200 Quantity Marginal Revenue Refer to Figure 15-6. What is the deadweight loss caused by a profit-maximizing monopoly? O O $150 $200 $250 Os300 A monopolist faces market demand given by P - 60 - Q. For this ma
Figure 15-6 Price $20+ Marginal Cost 100 150 200 Quantity Marginal Revenue Refer to Figure 15-6. What is the deadweight loss caused by a profit-maximizing monopoly? O O $150 $200 $250 Os300 A monopolist faces market demand given by P - 60 - Q. For this market, MR = 90 - 2Q and MC - Q. What price will the monopolist charge in order to maximize profits? O $20 O $30 O so Osso In Canada, in the majority of...
Consider the local telephone company, a natural monopoly. The following graph shows the demand curve for...
 Consider the local telephone company, a natural monopoly. The following graph shows the demand curve for phone services, the company's marginal revenue curve (labeled MR), Its marginal cost curve (labeled MC), and its average total cost curve (labeled ATC). You can hover over the points on the graph to see their exact coordinates. PRICE (Dollars per month) 200 180 ATC 160 140 120 100 Demand 80 60 40 MC 20 MR - 0 6 12 18 24 30 36 42...
 Practice Question 4. The inverse demand curve a monopoly faces is p = 30 – Q. The firm's total cost function is C(Q) = 0.5Q² and thus marginal cost function is MC(Q) = Q. (a) Determine the monopoly quantity, price and profit, and calculate the CS, PS and social welfare under the monopoly. (b) Determine the socially optimal outcome and calculate the CS, PS and social welfare under the social optimum. (c) Calculate the deadweight loss due to the monopolist...
 4. Suppose that a monopoly faces inverse demand given by P = 12-Q and has marginal cost equal to $2. (a) (5 points) Determine the equilibrium price, denoted by P (b) (5 points) If the market was instead served by perfectly competitive firms, then what is the equilibrium price? Denote it by P. (e) (4 points) If the monopolist can charge an entry fee in addition to its price P, then what is the optimal entry fee in this case?...
 Question 3 A monopolist faces a demand curve given by P = 105 - 30 where P is the price of the good and Q is the quantity demanded. The marginal cost of production is constant and is equal to $15. There are no fixed costs of production. Hint: To answer the following questions, it may be helpful to draw a graph! What quantity should the monopolist produce in order to maximize profit? What price should the monopolist charge in...
 5. A monopolist faces a demand curve P = 60 – 2Q and initially faces a constant marginal cost MC = 4. (a) Calculate the profit-maximizing monopoly quantity and price, and compute the monopolist's total rev- enue and profits at the optimal price. (b) Suppose that the monopolist's marginal cost in- creases to MC = 8. Verify that the monopolist's total revenue goes down. (c) Suppose that all firms in a perfectly competitive equilibrium had a constant marginal cost MC...
 1. (25 points) Suppose that a monopolist faces the inverse demand curve: P 100-Q and produces goods at a marginal cost of $5. Finally assume that the firm incurs no fixed costs A. Suppose the monopolist lowers the price from $90 to $89. Explain why the firm's marginal revenue is less than the price of the 11th unit sold, $89 (do not answer this question by providing a mathematical equation). B. At what price will the monopolist maximize its profit?...
 Consider the local telephone company, a natural monopoly. The following graph shows the demand curve for phone services, the company's marginal revenue curve (labeled MR), its marginal cost curve (labeled MC), and its average total cost curve (labeled ATC). You can hover over the points on the graph to see their exact coordinates. PRICE, COST, MR (Dollars per month) 100 90 80 70 60 Demand 50 40 30 ATC 20 MC 10 MR 54 60 30 36 42 48 0...
 Consider the local telephone company, a natural monopoly. The following graph shows the demand curve for phone services, the company's marginal revenue curve (labeled MR), Its marginal cost curve (labeled MC), and its average total cost curve (labeled ATC). You can hover over the points on the graph to see their exact coordinates. PRICE (Dollars per month) 200 180 ATC 160 140 120 100 Demand 80 60 40 MC 20 MR - 0 6 12 18 24 30 36 42...
Most questions answered within 3 hours.
-
Consider the reaction, C3 H8 + O2 --> CO2 + H2O. How many
moles of O2...
asked 20 minutes ago -
You and your opponent both roll a fair die. If you both roll the
same number,...
asked 37 minutes ago -
In a study of the accuracy of fast food drive-through orders,
Restaurant A had 257 accurate...
asked 37 minutes ago -
Identify and describe in detail the four categories of
institutions that could be included in a...
asked 42 minutes ago -
In python
class Customer:
def __init__(self, customer_id, last_name, first_name, phone_number, address):
self._customer_id = int(customer_id)
self._last_name =...
asked 50 minutes ago -
What is an example of a limitation in implementing a new
ERP system and how it...
asked 45 minutes ago -
In a section of 9.7cm of an artery with a radius of 2.6mm there
is a...
asked 46 minutes ago -
the two carboxylic acid groups of aspartic acid have different
acidities with pKa values of 2.1...
asked 50 minutes ago -
Would CuCO3 aqueous salt combined with calcium chloride
form a solid precipitate? If so, what would...
asked 49 minutes ago -
How do ECM Solutions assist in embedding a culture of continuous
improvement in an organization? (Project...
asked 1 hour ago -
Directions
These directions introduce the idea of Essential Questions.
Since this may be a new concept...
asked 1 hour ago -
1.b. Fiscal policy is said to suffer from ‘crowding out’.
Explain what this means and why...
asked 1 hour ago