
Homework Answers
Solution:
Given: for 80% confidence level , margin of error = E = +/- 4% and sample size = n = 900
We have to find sample size n for 90% confidence interval with same margin of error +/-4%.

Population standard deviation is not given but we can find it from given information.
Use Margin of Error formula:
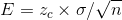
For c = 80% , find area = ( 1 + c) / 2 = ( 1+0.80) / 2 = 1.80 /2 = 0.90
Look in z table for area = 0.9000 or its closest area and find z value:

Area 0.8997 is closest to 0.9000 and it corresponds to 1.2 and 0.08
thus zc = 1.28
Thus

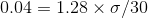
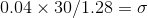

that is:

Now find sample size for 90% confidence level;
Zc is z critical value for c = 90% confidence level.
Find Area = ( 1 + c ) / 2 = ( 1 + 0.90) / 2 = 1.90 / 2 = 0.9500
Look in z table for Area = 0.9500 or its closest area and find corresponding z value.
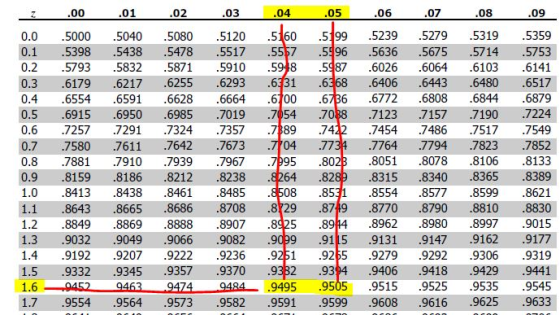
Area 0.9500 is in between 0.9495 and 0.9505 and both the area are at same distance from 0.9500
Thus we look for both area and find both z values
Thus Area 0.9495 corresponds to 1.64 and 0.9505 corresponds to 1.65
Thus average of both z values is : ( 1.64+1.65) / 2 = 1.645
Thus Zc = 1.645
Thus


Thus we need to select 1487 students.
Add Answer to:
900 college freshmen were randomly selected for a national survey. Among survey participants, the mean grade-point...
1,600 college freshmen were randomly selected for a national survey. Among survey participants, the mean grade-point...
 1,600 college freshmen were randomly selected for a national survey. Among survey participants, the mean grade-point average (GPA) was 3 , and the margin of error was 0.0343% for the 95% confidence interval. If we want to get a 85% confidence interval with a small margin of error 15%. How many students do you need to select? Remember that our answer is about actual people -- to answer this question you must round your number up to the nearest whole...
The grade point averages (GPA) of 18 randomly selected college students are used to estimate the...
The grade point averages (GPA) of 18 randomly selected college students are used to estimate the mean GPA of the college students. The GPAs from the sample are as follows: 2.3 3.3 2.6 1.8 0.2 3.1 4.0 0.7 3.1 2.3 2.0 3.1 3.4 1.3 2.6 2.6 3.7 2.2 (5 points) Is it justified to use of the standard normal distribution to construct the confidence interval? Explain. (10 points) If the population is assumed to be normally distributed, construct a 98% confidence interval for the population mean GPA. Show your work in detail and use 3...
The grade point averages (GPA) for 12 randomly selected college students are shown on the right....
 The grade point averages (GPA) for 12 randomly selected college
students are shown on the right. Complete parts (a) through (c)
below. Assume the population is normally distributed.
2.1, 3.1, 2.6, 1.5, 0.6, 4.0, 2.1, 1.1, 3.6, 0.5, 2.1, 3.4
construct a 90% confidence interval for the population mean
The grade point averages (GPA) for 12 randomly selected college students are shown on the right. Complete parts (a) through (c) 2.1 below. 1.5 Assume the population is normally distributed. 2.1...
The grade point averages (GPA) for 12 randomly selected college
students are shown on the right. Complete parts (a) through (c)
below. Assume the population is normally distributed.
2.1, 3.1, 2.6, 1.5, 0.6, 4.0, 2.1, 1.1, 3.6, 0.5, 2.1, 3.4
construct a 90% confidence interval for the population mean
The grade point averages (GPA) for 12 randomly selected college students are shown on the right. Complete parts (a) through (c) 2.1 below. 1.5 Assume the population is normally distributed. 2.1...
The grade point averages (GPA) for 15 randomly selected college students are: 2.3 3.3 2.6  
The grade point averages (GPA) for 15 randomly selected college students are: 2.3 3.3 2.6 1.8 0.2 3.1 0.7 4.0 2.3 2.0 3.1 3.4 13 26 26 Which of the following is the correct confidence interval procedure for a 95% confidence level?
Wo e parts (a) The grade point averages (GPA) for 12 randomly selected college students are...
 Wo e parts (a) The grade point averages (GPA) for 12 randomly selected college students are shown on the right Complet 0 0 1.6 0.8 40 2.1 1.1 3.5 0.4 2.4 3.3 through (c) below Assume the population is normally distributed (a) Find the sample mearn xRound to two decimal places as needed) (b) Find the sample standard deviation sRound to two decimal places as needed.) (c) Construct a 95% confidence interval for the population mean A 95% confidence interval...
The grade point averages (GPA) for 12 randomly selected college students are shown on the right....
 The grade point averages (GPA) for 12 randomly selected college students are shown on the right. Complete parts (a) through (c) below 2.5 34 2.6 1.9 0.5 4.0 2.2 1.2 3.8 0.2 2.3 3.1 Assume the population is normally distributed. (a) Find the sample mean. x(Round to two decimal places as needed) (b) Find the sample standard deviation. s(Round to two decimal places as needed.) (c) Construct a 95% confidence interval for the population mean A 95% confidence interval for...
The grade point averages (GPA) for 1212 randomly selected college students are shown on the right....
The grade point averages (GPA) for 1212 randomly selected college students are shown on the right. Complete parts (a) through (c) below. Assume the population is normally distributed. 2.52.5 3.33.3 2.92.9 1.91.9 0.80.8 4.04.0 2.42.4 1.41.4 3.73.7 0.40.4 2.12.1 3.43.4 (a) Find the sample mean. x overbarxequals=nothing (Round to two decimal places as needed.) (b) Find the sample standard deviation. sequals=nothing (Round to two decimal places as needed.)(c) Construct a 9999% confidence interval for the population mean muμ. A 9999%...
The grade point averages (GPA) for 12 randomly selected college students are shown on the right....
The grade point averages (GPA) for 12 randomly selected college students are shown on the right. Complete parts (a) through (c) below. Assume the population is normally distributed. 2.2 3.2 2.5 1.6 0.6 4.0 2.3 1.3 3.6 0.3 2.3 3.4 a) Find the sample mean. x overbar x equals= (Round to two decimal places as needed.) (b) Find the sample standard deviation. s equals= (Round to two decimal places as needed.) (c) Construct a 95% confidence interval for the population...
6. The grade point averages (GPA) for 15 randomly selected college students are: 3.3 2.6 1.8...
 6. The grade point averages (GPA) for 15 randomly selected college students are: 3.3 2.6 1.8 0.2 3.1 0.7 2.3 4.0 2.3 2.0 3.1 3.4 13 26 26 Which of the following is the correct confidence interval procedure for a 95% confidence level? A. SRS Normal told so o known * = 6.25 o=8.52 n= 15 95% CI Zinterval At the 95% confidence level, u is in (1.94, 10.565) B. SRS Normal by QQ graph * = 6.25 s=8.52 n=...
A statistics student at a New York State community college, randomly samples 900 students who own...
A statistics student at a New York State community college, randomly samples 900 students who own cell phones to determine if they play games on their phones. 75% stated that they use their mobile phones to play games. Using this information, then: construct a 90% confidence interval (to 4 decimal places) for the population proportion, p, of NYS community college cell phone users who play games on their phones. construct a 99% confidence interval (to 4 decimal places) for the...
 1,600 college freshmen were randomly selected for a national survey. Among survey participants, the mean grade-point average (GPA) was 3 , and the margin of error was 0.0343% for the 95% confidence interval. If we want to get a 85% confidence interval with a small margin of error 15%. How many students do you need to select? Remember that our answer is about actual people -- to answer this question you must round your number up to the nearest whole...
 The grade point averages (GPA) for 12 randomly selected college
students are shown on the right. Complete parts (a) through (c)
below. Assume the population is normally distributed.
2.1, 3.1, 2.6, 1.5, 0.6, 4.0, 2.1, 1.1, 3.6, 0.5, 2.1, 3.4
construct a 90% confidence interval for the population mean
The grade point averages (GPA) for 12 randomly selected college students are shown on the right. Complete parts (a) through (c) 2.1 below. 1.5 Assume the population is normally distributed. 2.1...
The grade point averages (GPA) for 12 randomly selected college
students are shown on the right. Complete parts (a) through (c)
below. Assume the population is normally distributed.
2.1, 3.1, 2.6, 1.5, 0.6, 4.0, 2.1, 1.1, 3.6, 0.5, 2.1, 3.4
construct a 90% confidence interval for the population mean
The grade point averages (GPA) for 12 randomly selected college students are shown on the right. Complete parts (a) through (c) 2.1 below. 1.5 Assume the population is normally distributed. 2.1...
 Wo e parts (a) The grade point averages (GPA) for 12 randomly selected college students are shown on the right Complet 0 0 1.6 0.8 40 2.1 1.1 3.5 0.4 2.4 3.3 through (c) below Assume the population is normally distributed (a) Find the sample mearn xRound to two decimal places as needed) (b) Find the sample standard deviation sRound to two decimal places as needed.) (c) Construct a 95% confidence interval for the population mean A 95% confidence interval...
 The grade point averages (GPA) for 12 randomly selected college students are shown on the right. Complete parts (a) through (c) below 2.5 34 2.6 1.9 0.5 4.0 2.2 1.2 3.8 0.2 2.3 3.1 Assume the population is normally distributed. (a) Find the sample mean. x(Round to two decimal places as needed) (b) Find the sample standard deviation. s(Round to two decimal places as needed.) (c) Construct a 95% confidence interval for the population mean A 95% confidence interval for...
 6. The grade point averages (GPA) for 15 randomly selected college students are: 3.3 2.6 1.8 0.2 3.1 0.7 2.3 4.0 2.3 2.0 3.1 3.4 13 26 26 Which of the following is the correct confidence interval procedure for a 95% confidence level? A. SRS Normal told so o known * = 6.25 o=8.52 n= 15 95% CI Zinterval At the 95% confidence level, u is in (1.94, 10.565) B. SRS Normal by QQ graph * = 6.25 s=8.52 n=...
Most questions answered within 3 hours.
-
Starting with benzene, synthesize 1-phenyl-1-butyne.
Show intermediates and reagents.
asked 27 minutes ago -
Create a 32-run crossed array design with six control factors
and two noise factors such that...
asked 1 hour ago -
A 500g sample of sand from source A has the following amounts
retained on each sieve....
asked 1 hour ago -
In
your own words, please explain the essay by John Keynes wrote "The
End of Laissez...
asked 1 hour ago -
How are the matrix and pixels related? Why are smaller
pixels better for diagnostic quality?
asked 1 hour ago -
2. An AC generator has 80 rectangular loops on
its armature. Each loop is 11 cm...
asked 1 hour ago -
Please help me with this question. Consider Aldi’s current and
potential geographic markets (see Exhibit 4...
asked 1 hour ago -
What are the main components of the fermentation process and
give an explanation of each? Include...
asked 1 hour ago -
Explain which types of cells in the body (belonging to which
organs, etc.) are sensitive to...
asked 1 hour ago -
A single cable supports an 703-kg elevator car. What is the
tension in the cable when...
asked 1 hour ago -
among the three different ways to link CSS specifications to an
HTML document (inline CSS, document...
asked 2 hours ago -
(1) Write the net ionic equation for the reaction that occurs
when equal volumes of 0.191...
asked 2 hours ago