
Homework Answers
8. The Statement is correct.
The long-run average cost curve is the envelope of firm's short run average cost curves. The typical long run average cost of a firm that has initally increasing returns to scale and then decreasing returns looks like the LRAC in the following figure-
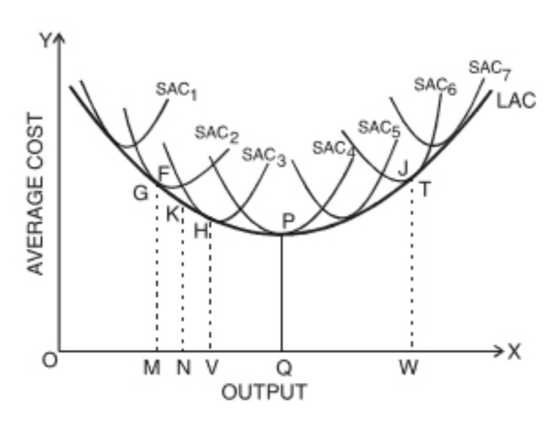
However, it must be noted that LRAC is not the envelope of all minimum point of short run average cost. In fact, LRAC is tangent to falling portion of short run average cost when LRAC is falling(increasing returns to scale) and LRAC is tangent to rising portion of short run average cost when LRAC is rising(diminishing returns to scale).
Thus, the given explaination of LRAC is correct.
Add Answer to:
#8
8. The long-run average cost curve is the envelope of the firm's short-run average cost...
If a firm has a U-Shaped long-run average cost curve, a
If a firm has a U-Shaped long-run average cost curve, a.) its fixed cost rises as output rises. b.) it must have increasing returns to scale at low levels or production and decreasing returns to scale at high levels of production. C.) it must have increasing returns to each input at low levels of production and decreasing returns to each input at high levels of production. D.) the firm can maximize its output by operating at the point of minimum...
Discuss why a firm's long run average cost curve is called an envelope curve. Will a firm in the ...
 Discuss why a firm's long run average cost curve is called an envelope curve. Will a firm in the long run always operate with productive efficiency? Discuss and illustrate with a graph. 2)
Discuss why a firm's long run average cost curve is called an envelope curve. Will a firm in the long run always operate with productive efficiency? Discuss and illustrate with a graph. 2)
Discuss why a firm's long run average cost curve is called an envelope curve. Will a firm in the long run always operate with productive efficiency? Discuss and illustrate with a graph. 2)
In the short run, there are many U-shaped cost curves. Which of the following explains why...
 In the short run, there are many U-shaped cost curves. Which of the following explains why the ATC is that way in the short run? It is U-shaped because the minimum efficient scale is achieved. It is U-shaped because the AFC declines as more goods are produced. It is U-shaped because of economies and diseconomies of scale. It is not U-shaped. It is U-shaped because of increasing and decreasing returns. If a firm is experiencing economies of scale, what is...
Long-run cost relationships The following graph shows the short-run average total cost curves and the long-run average total cost curve for a publishing firm.
 7. Long-run cost relationships The following graph shows the short-run average total cost curves and the long-run average total cost curve for a publishing firm. The five marked quantities indicate points of tangency between each short-run average total cost curve (SRATC) and the long-run average total cost curve (LRATC); for example, Q1 marks the point of tangency between SRATC1 and LRATC The orange point on SRATCs indicates the firm's current output level in the short run (Q5). SRATC SRATC SRATC4...
Question 3 Long-run average total cost (LAC) O a represents the lowest average cost of producing a given level of...
 Question 3 Long-run average total cost (LAC) O a represents the lowest average cost of producing a given level of output. b. is always equal to or greater than short-run average total cost. c. can be measured in the short-run. If a firm is producing the level of output at which long-run average cost equals long-run marginal cost, then a long-run marginal cost is at its minimum point b. long run average cost is at its minimum point. c long...
The following graph shows the short-run average total cost curves and the long-run average total cost...
 The following graph shows the short-run average total cost curves and the long-run average total cost curve for a publishing firm. The five marked quantities indicate points of tangency between each short-run average total cost curve (SRATC) and the long-run average total cost curve (LRATC); for example, Qı marks the point of tangency between SRATC1 and LRATC The orange point on SRATC, indicates the firm's current output level in the short run(Q). SRATC, SRATCE SRATC SRATC, SRATC COST PERUNT OUTPUT...
The following graph shows the short-run average total cost curves and the long-run average total cost...
 The following graph shows the short-run average total cost curves and the long-run average total cost curve for a publishing firm. The five marked quantities indicate points of tangency between each short-run average total cost curve (ATC) and the long-run average total cost curve (LRATC); for example, Qı marks the point of tangency between ATCi and LRATC The orange point on ATC1 indicates the firm's current output level in the short run (2) ATC, ATCs ATC ATC OUTPUT In the...
LIIS IS dll ustry and the long run supply curve is_ horizontal 3a. Does "returns to...
 LIIS IS dll ustry and the long run supply curve is_ horizontal 3a. Does "returns to scale" refer to the long or short run average cost curves? Rehirns ho scalssless the Doutput when All s are changed by the 3b. If returns to scale are increasing, what does this imply about average cost? 3c. If returns to scale are constant, what does this imply about average cost? 3d. If returns to scale are decreasing, what does this imply about average...
The following graph shows short-run marginal cost curves, short-run average cost curves, and a long-run average...
 The following graph shows short-run marginal cost curves, short-run average cost curves, and a long-run average total cost curve for a firm. Cost Curves 11 10 - 9 LRATC SRATC SRMC SRATC SRMC Per unit costs SRATO SRMC . 10 10 Quantity Which cost curves represent an efficient firm producing where there are diseconomies of scale? (Click to select) | Which cost curves represent an efficient firm producing where there are economies of scale? (Click to select) Which cost curves...
These two question please Question 8 (1 point) When do constant returns to scale occur? when...
 These two question please
Question 8 (1 point) When do constant returns to scale occur? when long-run total costs are constant as output increases when long-run average total costs are constant as output increases when the firm's long-run average-cost curve is falling as output increases when the firm's long-run average-cost curve is rising as output increases Figure 13-4 The curves in this figure reflect information about the average total cost, average fixed cost, average variable cost, and marginal cost for...
These two question please
Question 8 (1 point) When do constant returns to scale occur? when long-run total costs are constant as output increases when long-run average total costs are constant as output increases when the firm's long-run average-cost curve is falling as output increases when the firm's long-run average-cost curve is rising as output increases Figure 13-4 The curves in this figure reflect information about the average total cost, average fixed cost, average variable cost, and marginal cost for...
 Discuss why a firm's long run average cost curve is called an envelope curve. Will a firm in the long run always operate with productive efficiency? Discuss and illustrate with a graph. 2)
Discuss why a firm's long run average cost curve is called an envelope curve. Will a firm in the long run always operate with productive efficiency? Discuss and illustrate with a graph. 2)
Discuss why a firm's long run average cost curve is called an envelope curve. Will a firm in the long run always operate with productive efficiency? Discuss and illustrate with a graph. 2)
 In the short run, there are many U-shaped cost curves. Which of the following explains why the ATC is that way in the short run? It is U-shaped because the minimum efficient scale is achieved. It is U-shaped because the AFC declines as more goods are produced. It is U-shaped because of economies and diseconomies of scale. It is not U-shaped. It is U-shaped because of increasing and decreasing returns. If a firm is experiencing economies of scale, what is...
 7. Long-run cost relationships The following graph shows the short-run average total cost curves and the long-run average total cost curve for a publishing firm. The five marked quantities indicate points of tangency between each short-run average total cost curve (SRATC) and the long-run average total cost curve (LRATC); for example, Q1 marks the point of tangency between SRATC1 and LRATC The orange point on SRATCs indicates the firm's current output level in the short run (Q5). SRATC SRATC SRATC4...
 Question 3 Long-run average total cost (LAC) O a represents the lowest average cost of producing a given level of output. b. is always equal to or greater than short-run average total cost. c. can be measured in the short-run. If a firm is producing the level of output at which long-run average cost equals long-run marginal cost, then a long-run marginal cost is at its minimum point b. long run average cost is at its minimum point. c long...
 The following graph shows the short-run average total cost curves and the long-run average total cost curve for a publishing firm. The five marked quantities indicate points of tangency between each short-run average total cost curve (SRATC) and the long-run average total cost curve (LRATC); for example, Qı marks the point of tangency between SRATC1 and LRATC The orange point on SRATC, indicates the firm's current output level in the short run(Q). SRATC, SRATCE SRATC SRATC, SRATC COST PERUNT OUTPUT...
 The following graph shows the short-run average total cost curves and the long-run average total cost curve for a publishing firm. The five marked quantities indicate points of tangency between each short-run average total cost curve (ATC) and the long-run average total cost curve (LRATC); for example, Qı marks the point of tangency between ATCi and LRATC The orange point on ATC1 indicates the firm's current output level in the short run (2) ATC, ATCs ATC ATC OUTPUT In the...
 LIIS IS dll ustry and the long run supply curve is_ horizontal 3a. Does "returns to scale" refer to the long or short run average cost curves? Rehirns ho scalssless the Doutput when All s are changed by the 3b. If returns to scale are increasing, what does this imply about average cost? 3c. If returns to scale are constant, what does this imply about average cost? 3d. If returns to scale are decreasing, what does this imply about average...
 The following graph shows short-run marginal cost curves, short-run average cost curves, and a long-run average total cost curve for a firm. Cost Curves 11 10 - 9 LRATC SRATC SRMC SRATC SRMC Per unit costs SRATO SRMC . 10 10 Quantity Which cost curves represent an efficient firm producing where there are diseconomies of scale? (Click to select) | Which cost curves represent an efficient firm producing where there are economies of scale? (Click to select) Which cost curves...
 These two question please
Question 8 (1 point) When do constant returns to scale occur? when long-run total costs are constant as output increases when long-run average total costs are constant as output increases when the firm's long-run average-cost curve is falling as output increases when the firm's long-run average-cost curve is rising as output increases Figure 13-4 The curves in this figure reflect information about the average total cost, average fixed cost, average variable cost, and marginal cost for...
These two question please
Question 8 (1 point) When do constant returns to scale occur? when long-run total costs are constant as output increases when long-run average total costs are constant as output increases when the firm's long-run average-cost curve is falling as output increases when the firm's long-run average-cost curve is rising as output increases Figure 13-4 The curves in this figure reflect information about the average total cost, average fixed cost, average variable cost, and marginal cost for...
Most questions answered within 3 hours.
-
when 2053 j of heat is added to 46.3 g of hexane C6H14 the
temperature increases...
asked 33 seconds from now -
a)An ideal heat pump is being considered for use in heating an
environment with a temperature...
asked 21 seconds from now -
.
Convert the following pairs of voltage and current waveforms to
phasor form. Each pair of...
asked 1 minute ago -
I need new and unique answers, please. (Use your own words,
don't copy and paste), Please...
asked 2 minutes ago -
A 6.5 cm diameter ball has a terminal speed of 22 m/s. What is
the ball's...
asked 14 minutes ago -
Name two areas of the human body with the highest concentration
of lymph nodes and speculate...
asked 18 minutes ago -
Angel Corporation has $10,000,000 of
8.0% 25 year bonds dated May 1, 2018 with interest payable...
asked 53 minutes ago -
7.
________ involves individuals trading goods they already have or
providing services in exchange for something...
asked 57 minutes ago -
Share your research problem. What databases did you search as
you gathered evidence to support your...
asked 57 minutes ago -
what process occurs to form microspores and megaspores in flowering
plants?
asked 1 hour ago -
C++
I need to use the function getData to put in all my data using
arrays....
asked 1 hour ago -
A block is hung by a string from the inside roof of a van. When
the...
asked 1 hour ago