- What does the coefficient estimate for lnNumHH tell you?
- Do you think there is a problem with the regression, if so what is the problem?
Homework Answers
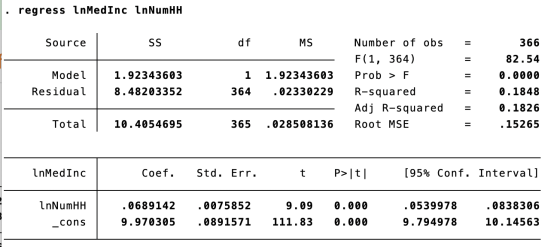
the coefficient estimate of lnNumHH shows that the regression line between lnMedInc is
lnMedInc = 9.970305 + 0.0689142( lnNumHH )
its howa that an increase in the value of lnNumHH will increace the absolute value of constant by 0.0689142.
the problem with the regression is both the variables lnMedInc and lnNumHH will explain the entire model by R-squared value 0.1848
Its mean the model of regression is not a good model because of both the variable lnMedInc and lnNumHH explained the entire model by 18.48%
Add Answer to:
What does the coefficient estimate for lnNumHH tell you?
Do you think there is a problem...
please interpret the regress result findings (sign, coefficient, statistical significance, R^2, Adjusted R^2) for each independent...
 please interpret the regress result findings (sign, coefficient,
statistical significance, R^2, Adjusted R^2) for each independent
variable in the NBA salary model
regress salary laggaterevenue lagwp48 Source SS df MS Model Residual 1.1647e+15 8.0148e+15 2 423 5.8236e+14 1.8947e+13 Number of obs F(2, 423) Prob > F R-squared Adj R-squared Root MSE 426 30.74 0.0000 0.1269 0.1228 4.4e+06 = Total 9.1795e+15 425 2.1599e+13 = salary Coef. Std. Err. t P>|t| [95% Conf. Interval] laggaterevene lagwp48 _cons .0044275 1.34e+07 3448595 .0109924 1732419...
please interpret the regress result findings (sign, coefficient,
statistical significance, R^2, Adjusted R^2) for each independent
variable in the NBA salary model
regress salary laggaterevenue lagwp48 Source SS df MS Model Residual 1.1647e+15 8.0148e+15 2 423 5.8236e+14 1.8947e+13 Number of obs F(2, 423) Prob > F R-squared Adj R-squared Root MSE 426 30.74 0.0000 0.1269 0.1228 4.4e+06 = Total 9.1795e+15 425 2.1599e+13 = salary Coef. Std. Err. t P>|t| [95% Conf. Interval] laggaterevene lagwp48 _cons .0044275 1.34e+07 3448595 .0109924 1732419...
Given the following regression output in Stata Indicate what is the effect of x2 on Y...
 Given the following regression output in Stata
Indicate what is the effect of x2 on Y by testing the hypothesis
that x2 determines Y given
· regress y xl x2 Source SS dEMS Model Residual 2.6644e+092 1.3322e+09 26878436.6 12 2239869.72 Number of obs = F( 2, 12) = Prob > F R-squared Adj R-squared = Root MSE 15 594.76 0.0000 0.9900 0.9883 1496.6 Total 2.6912e+0914 2.6912 192231167 Coef. Std. Err. t >It (95% Conf. Intervall x1 2.44061 .3440342 -32137.37 6.125326...
Given the following regression output in Stata
Indicate what is the effect of x2 on Y by testing the hypothesis
that x2 determines Y given
· regress y xl x2 Source SS dEMS Model Residual 2.6644e+092 1.3322e+09 26878436.6 12 2239869.72 Number of obs = F( 2, 12) = Prob > F R-squared Adj R-squared = Root MSE 15 594.76 0.0000 0.9900 0.9883 1496.6 Total 2.6912e+0914 2.6912 192231167 Coef. Std. Err. t >It (95% Conf. Intervall x1 2.44061 .3440342 -32137.37 6.125326...
Write one paragraph describing the results of your analysis as they relate to your initial hypothesis...
 Write one paragraph describing the results of your analysis as
they relate to your initial hypothesis ( if you live in colder
areas, the rate of homelessness and unemployment are less
).
· regress HOMLSTOT UNEMRATE AVGTEMP Source SS df MS Model 160347072 2.2246e+09 2 80173535.9 32 69520191.8 Number of obs F(2, 32) Prob > F R-squared Adj R-squared Root MSE 35 1.15 0.3284 0.0672 0.0089 8337.9 Residual Total 2.3850e+09 34 70146859.1 HOMLSTOT Coef. Std. Err. t P> [t] [95%...
Write one paragraph describing the results of your analysis as
they relate to your initial hypothesis ( if you live in colder
areas, the rate of homelessness and unemployment are less
).
· regress HOMLSTOT UNEMRATE AVGTEMP Source SS df MS Model 160347072 2.2246e+09 2 80173535.9 32 69520191.8 Number of obs F(2, 32) Prob > F R-squared Adj R-squared Root MSE 35 1.15 0.3284 0.0672 0.0089 8337.9 Residual Total 2.3850e+09 34 70146859.1 HOMLSTOT Coef. Std. Err. t P> [t] [95%...
A researcher is examining the effect of number of years in a particular job (tenure) on...
 A researcher is examining the effect of number of years in a
particular job (tenure) on the hourly wage (USD) earned. She
estimates two regression models using data on 124 young women
surveyed in 1988. In the first regression, she regressed logged
hourly wage on logged tenure in the current job (years in current
job). In the second regression she regressed logged hourly wage on
logged tenure in the current job, as well as age, total years of
schooling completed,...
A researcher is examining the effect of number of years in a
particular job (tenure) on the hourly wage (USD) earned. She
estimates two regression models using data on 124 young women
surveyed in 1988. In the first regression, she regressed logged
hourly wage on logged tenure in the current job (years in current
job). In the second regression she regressed logged hourly wage on
logged tenure in the current job, as well as age, total years of
schooling completed,...
You are given different sets of Stata output below. Please use the appropriate Stata output to...
 You are given different sets of Stata output below. Please use the appropriate Stata output to answer questions below.log price is the natural log of price. a. Write the estimated equation from a regression of log price on mpg, weight, headroom, and trunk. Interpret each coefficient. b. Test if headroom and trunk have no effect on price. Please show your work. Source | SS df MS Model Residual 3.82089653 7.40263655 4 69 .955224132 .107284588 Number of obs = FC 4,...
Suppose SAT score and high school graduating class size (hsize, scaled in terms of 100 students)...
 Suppose SAT score and high school graduating class size (hsize, scaled in terms of 100 students) are correlated and the unobserved factors denoted by u. Then SAT = B + Bhsize+u. ss df - • reg sat hsize Source Model 324242.826 Residual 1 80049603.5 Total 1 80373846.3 1 4.135 MS 324242.826 19359.0335 19432.7481 Number of obs F(1, 4135) Prob > F R-squared Adj R-squared Root MSE 4.137 16.75 0.0000 4,136 0.0038 139.14 sat hsize _cons Coef. 5.098593 1016.056 Std. Err....
In the solution proposal DF = 21 when testing this hypotheses, but when doing a f test for significant regression DF is 24. I need help understanding this:) Regards Richard df MS Source I Number of o...
 In the solution proposal DF = 21 when testing this hypotheses,
but when doing a f test for significant regression DF is 24.
I need help understanding this:)
Regards Richard
df MS Source I Number of obs 27 2. 24) - 200.25 - 0.0000 О. 9435 Adj R-squared 0.9388 .18837 2 7.10578187 Residual! .85163374 24.035484739 Model 14.2115637 Prob F R-squared Total 15.0631975 26.57935375 Root MSE Coef. Std. Err. [95% Conf. Interval] 125954 085346 .326782 1nLI.6029994 1nK I.3757102 cons1.170644 2.790.000 4.40...
In the solution proposal DF = 21 when testing this hypotheses,
but when doing a f test for significant regression DF is 24.
I need help understanding this:)
Regards Richard
df MS Source I Number of obs 27 2. 24) - 200.25 - 0.0000 О. 9435 Adj R-squared 0.9388 .18837 2 7.10578187 Residual! .85163374 24.035484739 Model 14.2115637 Prob F R-squared Total 15.0631975 26.57935375 Root MSE Coef. Std. Err. [95% Conf. Interval] 125954 085346 .326782 1nLI.6029994 1nK I.3757102 cons1.170644 2.790.000 4.40...
Based on the multiple regression model, does demand for beef respond significantly to price of pork?...
 Based on the multiple regression model, does demand for beef
respond significantly to price of pork? Why?
df MS - - - - Source SS -----------+------- Model | 235.766738 Residual 57.3509099 ----------- ------- Total L 293.117648 3 13 78.5889127 4.41160845 Number of obs = EU3, 13) = Prob>F = R-squared = Adj R-squared = Root MSE = 17 17.81 0.0001 0.8043 0.7592 2.1004 - - - - - - - - - - - 16 18.319853 - - - -...
Based on the multiple regression model, does demand for beef
respond significantly to price of pork? Why?
df MS - - - - Source SS -----------+------- Model | 235.766738 Residual 57.3509099 ----------- ------- Total L 293.117648 3 13 78.5889127 4.41160845 Number of obs = EU3, 13) = Prob>F = R-squared = Adj R-squared = Root MSE = 17 17.81 0.0001 0.8043 0.7592 2.1004 - - - - - - - - - - - 16 18.319853 - - - -...
A researcher is examining the effect of number of years in a particular job (tenure) on...
 A researcher is examining the effect of number of years in a particular job (tenure) on the hourly wage (USD) earned. She estimates two regression models using data on 124 young women surveyed in 1988. In the first regression, she regressed logged hourly wage on logged tenure in the current job (years in current job). In the second regression she regressed logged hourly wage on logged tenure in the current job, as well as age, total years of schooling completed,...
Question 1 First run the regression: EARNINGSi = β1 + β2ASVABCi + β3Si + ui Then...
 Question 1
First run the regression:
EARNINGSi = β1 + β2ASVABCi + β3Si + ui
Then run the regression with experience:
EARNINGSi = β1 + β2ASVABCi + β3Si + β4EXPi + ui
Compare the results from these two regressions, do you get an
indication that the previous estimate of schooling without EXP was
biased? If so, in which direction? And why is that?
Question 2
Add gender dummy variable to the regression (the one running
regression of EARNINGS on ASVABC,...
Question 1
First run the regression:
EARNINGSi = β1 + β2ASVABCi + β3Si + ui
Then run the regression with experience:
EARNINGSi = β1 + β2ASVABCi + β3Si + β4EXPi + ui
Compare the results from these two regressions, do you get an
indication that the previous estimate of schooling without EXP was
biased? If so, in which direction? And why is that?
Question 2
Add gender dummy variable to the regression (the one running
regression of EARNINGS on ASVABC,...
 please interpret the regress result findings (sign, coefficient,
statistical significance, R^2, Adjusted R^2) for each independent
variable in the NBA salary model
regress salary laggaterevenue lagwp48 Source SS df MS Model Residual 1.1647e+15 8.0148e+15 2 423 5.8236e+14 1.8947e+13 Number of obs F(2, 423) Prob > F R-squared Adj R-squared Root MSE 426 30.74 0.0000 0.1269 0.1228 4.4e+06 = Total 9.1795e+15 425 2.1599e+13 = salary Coef. Std. Err. t P>|t| [95% Conf. Interval] laggaterevene lagwp48 _cons .0044275 1.34e+07 3448595 .0109924 1732419...
please interpret the regress result findings (sign, coefficient,
statistical significance, R^2, Adjusted R^2) for each independent
variable in the NBA salary model
regress salary laggaterevenue lagwp48 Source SS df MS Model Residual 1.1647e+15 8.0148e+15 2 423 5.8236e+14 1.8947e+13 Number of obs F(2, 423) Prob > F R-squared Adj R-squared Root MSE 426 30.74 0.0000 0.1269 0.1228 4.4e+06 = Total 9.1795e+15 425 2.1599e+13 = salary Coef. Std. Err. t P>|t| [95% Conf. Interval] laggaterevene lagwp48 _cons .0044275 1.34e+07 3448595 .0109924 1732419...
 Given the following regression output in Stata
Indicate what is the effect of x2 on Y by testing the hypothesis
that x2 determines Y given
· regress y xl x2 Source SS dEMS Model Residual 2.6644e+092 1.3322e+09 26878436.6 12 2239869.72 Number of obs = F( 2, 12) = Prob > F R-squared Adj R-squared = Root MSE 15 594.76 0.0000 0.9900 0.9883 1496.6 Total 2.6912e+0914 2.6912 192231167 Coef. Std. Err. t >It (95% Conf. Intervall x1 2.44061 .3440342 -32137.37 6.125326...
Given the following regression output in Stata
Indicate what is the effect of x2 on Y by testing the hypothesis
that x2 determines Y given
· regress y xl x2 Source SS dEMS Model Residual 2.6644e+092 1.3322e+09 26878436.6 12 2239869.72 Number of obs = F( 2, 12) = Prob > F R-squared Adj R-squared = Root MSE 15 594.76 0.0000 0.9900 0.9883 1496.6 Total 2.6912e+0914 2.6912 192231167 Coef. Std. Err. t >It (95% Conf. Intervall x1 2.44061 .3440342 -32137.37 6.125326...
 Write one paragraph describing the results of your analysis as
they relate to your initial hypothesis ( if you live in colder
areas, the rate of homelessness and unemployment are less
).
· regress HOMLSTOT UNEMRATE AVGTEMP Source SS df MS Model 160347072 2.2246e+09 2 80173535.9 32 69520191.8 Number of obs F(2, 32) Prob > F R-squared Adj R-squared Root MSE 35 1.15 0.3284 0.0672 0.0089 8337.9 Residual Total 2.3850e+09 34 70146859.1 HOMLSTOT Coef. Std. Err. t P> [t] [95%...
Write one paragraph describing the results of your analysis as
they relate to your initial hypothesis ( if you live in colder
areas, the rate of homelessness and unemployment are less
).
· regress HOMLSTOT UNEMRATE AVGTEMP Source SS df MS Model 160347072 2.2246e+09 2 80173535.9 32 69520191.8 Number of obs F(2, 32) Prob > F R-squared Adj R-squared Root MSE 35 1.15 0.3284 0.0672 0.0089 8337.9 Residual Total 2.3850e+09 34 70146859.1 HOMLSTOT Coef. Std. Err. t P> [t] [95%...
 A researcher is examining the effect of number of years in a
particular job (tenure) on the hourly wage (USD) earned. She
estimates two regression models using data on 124 young women
surveyed in 1988. In the first regression, she regressed logged
hourly wage on logged tenure in the current job (years in current
job). In the second regression she regressed logged hourly wage on
logged tenure in the current job, as well as age, total years of
schooling completed,...
A researcher is examining the effect of number of years in a
particular job (tenure) on the hourly wage (USD) earned. She
estimates two regression models using data on 124 young women
surveyed in 1988. In the first regression, she regressed logged
hourly wage on logged tenure in the current job (years in current
job). In the second regression she regressed logged hourly wage on
logged tenure in the current job, as well as age, total years of
schooling completed,...
 You are given different sets of Stata output below. Please use the appropriate Stata output to answer questions below.log price is the natural log of price. a. Write the estimated equation from a regression of log price on mpg, weight, headroom, and trunk. Interpret each coefficient. b. Test if headroom and trunk have no effect on price. Please show your work. Source | SS df MS Model Residual 3.82089653 7.40263655 4 69 .955224132 .107284588 Number of obs = FC 4,...
 Suppose SAT score and high school graduating class size (hsize, scaled in terms of 100 students) are correlated and the unobserved factors denoted by u. Then SAT = B + Bhsize+u. ss df - • reg sat hsize Source Model 324242.826 Residual 1 80049603.5 Total 1 80373846.3 1 4.135 MS 324242.826 19359.0335 19432.7481 Number of obs F(1, 4135) Prob > F R-squared Adj R-squared Root MSE 4.137 16.75 0.0000 4,136 0.0038 139.14 sat hsize _cons Coef. 5.098593 1016.056 Std. Err....
 In the solution proposal DF = 21 when testing this hypotheses,
but when doing a f test for significant regression DF is 24.
I need help understanding this:)
Regards Richard
df MS Source I Number of obs 27 2. 24) - 200.25 - 0.0000 О. 9435 Adj R-squared 0.9388 .18837 2 7.10578187 Residual! .85163374 24.035484739 Model 14.2115637 Prob F R-squared Total 15.0631975 26.57935375 Root MSE Coef. Std. Err. [95% Conf. Interval] 125954 085346 .326782 1nLI.6029994 1nK I.3757102 cons1.170644 2.790.000 4.40...
In the solution proposal DF = 21 when testing this hypotheses,
but when doing a f test for significant regression DF is 24.
I need help understanding this:)
Regards Richard
df MS Source I Number of obs 27 2. 24) - 200.25 - 0.0000 О. 9435 Adj R-squared 0.9388 .18837 2 7.10578187 Residual! .85163374 24.035484739 Model 14.2115637 Prob F R-squared Total 15.0631975 26.57935375 Root MSE Coef. Std. Err. [95% Conf. Interval] 125954 085346 .326782 1nLI.6029994 1nK I.3757102 cons1.170644 2.790.000 4.40...
 Based on the multiple regression model, does demand for beef
respond significantly to price of pork? Why?
df MS - - - - Source SS -----------+------- Model | 235.766738 Residual 57.3509099 ----------- ------- Total L 293.117648 3 13 78.5889127 4.41160845 Number of obs = EU3, 13) = Prob>F = R-squared = Adj R-squared = Root MSE = 17 17.81 0.0001 0.8043 0.7592 2.1004 - - - - - - - - - - - 16 18.319853 - - - -...
Based on the multiple regression model, does demand for beef
respond significantly to price of pork? Why?
df MS - - - - Source SS -----------+------- Model | 235.766738 Residual 57.3509099 ----------- ------- Total L 293.117648 3 13 78.5889127 4.41160845 Number of obs = EU3, 13) = Prob>F = R-squared = Adj R-squared = Root MSE = 17 17.81 0.0001 0.8043 0.7592 2.1004 - - - - - - - - - - - 16 18.319853 - - - -...
 A researcher is examining the effect of number of years in a particular job (tenure) on the hourly wage (USD) earned. She estimates two regression models using data on 124 young women surveyed in 1988. In the first regression, she regressed logged hourly wage on logged tenure in the current job (years in current job). In the second regression she regressed logged hourly wage on logged tenure in the current job, as well as age, total years of schooling completed,...
 Question 1
First run the regression:
EARNINGSi = β1 + β2ASVABCi + β3Si + ui
Then run the regression with experience:
EARNINGSi = β1 + β2ASVABCi + β3Si + β4EXPi + ui
Compare the results from these two regressions, do you get an
indication that the previous estimate of schooling without EXP was
biased? If so, in which direction? And why is that?
Question 2
Add gender dummy variable to the regression (the one running
regression of EARNINGS on ASVABC,...
Question 1
First run the regression:
EARNINGSi = β1 + β2ASVABCi + β3Si + ui
Then run the regression with experience:
EARNINGSi = β1 + β2ASVABCi + β3Si + β4EXPi + ui
Compare the results from these two regressions, do you get an
indication that the previous estimate of schooling without EXP was
biased? If so, in which direction? And why is that?
Question 2
Add gender dummy variable to the regression (the one running
regression of EARNINGS on ASVABC,...
Most questions answered within 3 hours.
-
A 1.3 eV electron has a 10-4 probability of tunneling
through a 2.4 eV potential barrier....
asked 11 minutes ago -
What is the one ingredient that is common to being successful
with all stakeholders?
profit
trust...
asked 10 minutes ago -
Write an assembly language 32 bit program that reads in lines of
text by a .txt...
asked 12 minutes ago -
what is the density ( in g/L) of hydrogen gas at 29 degrees C and a...
asked 21 minutes ago -
5-6. You are considering three investment alternatives for some
spare cash: Old Reliable Corporation stock (A1),...
asked 13 minutes ago -
Problem 16-02
Receivables Investment
Medwig Corporation has a DSO of 45 days. The company averages
$7,250...
asked 28 minutes ago -
Mr. Brown hired Lowe's Maintenance Services Limited to repair
and paint the exterior wall of his...
asked 29 minutes ago -
When might an index slow down the overall performance of the
database? Choose the best answer....
asked 34 minutes ago -
Due to a recession, expected inflation this year is only 2.25%.
However, the inflation rate in...
asked 35 minutes ago -
Write four functions: (IN PYTHON 3)
1) bound(l) - given a list of integers l, compute...
asked 37 minutes ago -
A quarterback throws a football. When the football leaves his
hand, it has a horizontal velocity...
asked 45 minutes ago -
he term "reproductive isolation mechanism" refers to
inability of a species to continue reproduction
specific areas...
asked 47 minutes ago