

Homework Answers
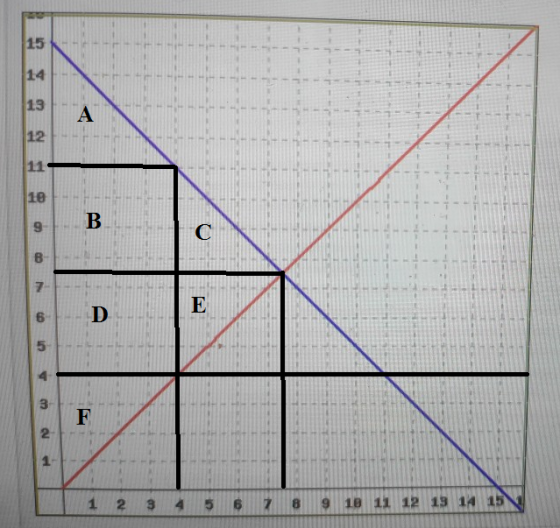
In this market, the price ceiling of $4 is binding because market price is $6.5
Consumer Surplus changes from A + B + C to A + B + D
= 0.5*(15 – 4 + 11 – 4)*4 – 0.5*(15 – 7.5)*7.5
= 7.875
Hence, consumer surplus increases
Consumer surplus rises by 7.875
Producer surplus falls from D + E + F to now F
Fall in producer surplus = D + E = 0.5*(7.5 – 4)*(7.5 + 4) = 20.125
DWL = C + E = 0.5*(11 – 4)*(7.5 – 4) = 12.25
DWL due to little gasoline sold = E = 0.5*(7.5 – 4)*(7.5 – 4) = 3.125
DWL due to time wasted = 0.5*(11 – 7.5)*(7.5 – 4) = 6.125
Consumer surplus is increased by $7.875 and this is the gain which can be compensated for the loss while waiting. This implies that we can wait for at most 7.875/2 = 3 hours
Add Answer to:
(1 point) The graph below shows the demand and supply for gasoline, Suppose the government imposes...
(1 point) The below graph shows the demand and supply for sweet potato pies, Suppose the...
 (1 point) The below graph shows the demand and supply for sweet potato pies, Suppose the government imposes a sales tax of $7 per pie. What is the new price of pies? How much do consumers pay per pie (including tax)? Does consumer surplus increase or decrease? ? By how much? Note: Your answer should be a number of dollars. Notice that the demand and supply curves are straight lines so you can use the formula for the area of...
Consider the market for mountain bikes. The following graph shows the demand and supply for mountain bikes before the government imposes any taxes.
 Consider the market for mountain bikes. The following graph shows the demand and supply for mountain bikes before the government imposes any taxes. First, use the black point (plus symbol) to indicate the equilibrium price and quantity of mountain bikes in the absence of a tax. Then use the green point (triangle symbol) to shade the area representing total consumer surplus (CS) at the equilibrium price. Next, use the purple point (diamond symbol) to shade the area representing total producer surplus...
Consider the market for designer purses. The following graph shows the demand and supply for designer purses before the government imposes any taxes.
 2. Taxes and welfare Consider the market for designer purses. The following graph shows the demand and supply for designer purses before the government imposes any taxes. First, use the black point (plus symbol) to indicate the equilibrium price and quantity of designer purses in the absence of a tax. Then use the green point (triangle symbol) to shade the area representing total consumer surplus (CS) at the equilibrium price. Next, use the purple point (diamond symbol) to shade the area representing...
Consider the market for commercial fans. The following graph shows the demand and supply for commercial fans before the government imposes any taxes.
 Consider the market for commercial fans. The following graph shows the demand and supply for commercial fans before the government imposes any taxes. First, use the black point (plus symbol) to indicate the equilibrium price and quantity of commercial fans in the absence of a tax. Then use the green point (triangle symbol) to shade the area representing total consumer surplus (CS) at the equilibrium price. Next, use the purple point (diamond symbol) to shade the area representing total producer surplus...
(1 point) The following graph shows the American supply and demand curves for cameras. Both curves...
 (1 point) The following graph shows the American supply and demand curves for cameras. Both curves are straight lines. Japanese cameras, which are identical to American cameras, can be purchased in any quantity for a price of $8 per camera. How many cameras do American's buy? How many cameras do American firms sell? How many cameras are imported from Japan? Suppose the U.S. government imposes a tariff of $4 per Japanese camera. How many cameras are imported? Does the tariff...
Question 1: For an industry, Q 40 - Pd and Q. Suppose the government imposes a...
 Question 1: For an industry, Q 40 - Pd and Q. Suppose the government imposes a price floor of s28. Complete the following table and explain how you derived your answers No Price Floor Price Floor Consumer Surplus Producer Surplus Total Surplus Deadweight Loss
Consider the market for mountain bikes. The following graph shows the demand and supply for mountain bikes before the govemment imposes any taxes.
 2. Taxes and welfare Consider the market for mountain bikes. The following graph shows the demand and supply for mountain bikes before the govemment imposes any taxes. First, use the black point (plus symbol) to indicate the equilibrium price and quantity of mountain bikes in the absence of a tax. Then use the green point (triangle symbol) to shade the area representing total consumer surplus (CS) at the equilibrium price. Next, use the purple point (diamond symbol) to shade the area representing...
Consider the market for mountain bikes. The following graph shows the demand and supply for mountain bikes before the government imposes any taxes.
 Consider the market for mountain bikes. The following graph shows the demand and supply for mountain bikes before the government imposes any taxes. First, use tfhe black point (plus symbol) to indicate the equilibrium price and quantity of mountain bikes in the absence of a tax. Then use the green point (triangle symbol) to shade the area representing total consumer surplus (CS) at the equilibrium price. Next, use the purple point (diamond symbol) to shade the area representing total producer surplus...
Suppose the gasoline market is competitive and that the government grants a subsidy to the industry...
Suppose the gasoline market is competitive and that the government grants a subsidy to the industry of 20 cents per gallon. Demonstrate and explain how the subsidy will affect price, output, and consumer and producer surplus. Show the dead-weight (or social) loss from the subsidy.
 (1 point) The below graph shows the demand and supply for sweet potato pies, Suppose the government imposes a sales tax of $7 per pie. What is the new price of pies? How much do consumers pay per pie (including tax)? Does consumer surplus increase or decrease? ? By how much? Note: Your answer should be a number of dollars. Notice that the demand and supply curves are straight lines so you can use the formula for the area of...
 (1 point) The following graph shows the American supply and demand curves for cameras. Both curves are straight lines. Japanese cameras, which are identical to American cameras, can be purchased in any quantity for a price of $8 per camera. How many cameras do American's buy? How many cameras do American firms sell? How many cameras are imported from Japan? Suppose the U.S. government imposes a tariff of $4 per Japanese camera. How many cameras are imported? Does the tariff...
 Question 1: For an industry, Q 40 - Pd and Q. Suppose the government imposes a price floor of s28. Complete the following table and explain how you derived your answers No Price Floor Price Floor Consumer Surplus Producer Surplus Total Surplus Deadweight Loss
Most questions answered within 3 hours.
-
A crate slides up a frictionless slope. At the end of 3 seconds
its velocity is...
asked 7 minutes ago -
Use the following information to answer the next seven
questions.
Suppose there are three potential states...
asked 3 minutes ago -
If we only have interstitial and substitutional diffusion, then
what do we consider the process of...
asked 19 minutes ago -
You look at yourself in a shiny 9.6-cm-diameter Christmas tree
ball.
If your face is 21.0...
asked 21 minutes ago -
If we were to measure the relaxation time of a muscle after
undergoing tetanus compared to...
asked 21 minutes ago -
4CO(g) + 8H2(g) -----> 3CH4(g) +
CO2(g) + 2H2O(l)
Use the following data as needed to...
asked 24 minutes ago -
without using map
1. Write a C++ program to find out the top 10 words in...
asked 37 minutes ago -
1)Calculate the percent ionization of a
0.330 M solution of hypochlorous
acid.
% Ionization = %...
asked 40 minutes ago -
1a) How many grams of K2SO4 are in 250mL
of 0.11 M K2SO4 solution?
_____ g...
asked 31 minutes ago -
The vapor pressure of a solution containing 38.7 g glycerin
(C3H8O3) in 146.2 g ethanol (C2H5OH)...
asked 36 minutes ago -
A physics major is cooking breakfast when he notices that the
frictional force between the steel...
asked 41 minutes ago -
A cyclohexane (c-hex) solution is prepared by fully dissolving
9.11g of a newly synthesized organic compound...
asked 47 minutes ago