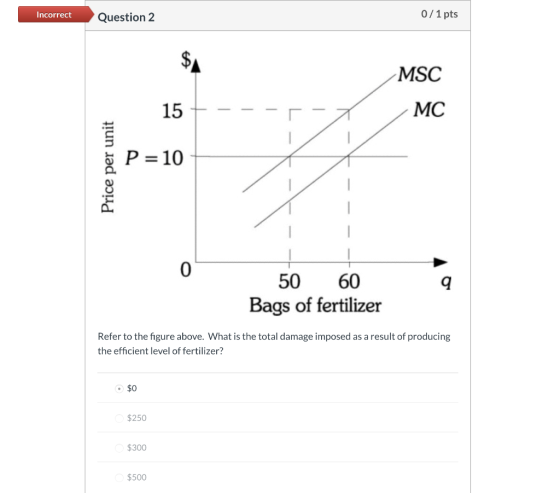
Refer to the figure above. What is the total damage imposed as a result of producing the efficient level of fertilizer?
Homework Answers
There are two cost production cost and damage.
At efficient outcome equal to 50.
The total damage cost=per unit damage cost* efficient outcome=5*50=250
Option B is right.
Note:Even firm producing efficient level of fertilizer but the damage cost didn't vanish .it still occuring.
Due to efficent level of outcome ,the deadweight loss vanished ( loss of surplus).
Add Answer to:
Refer to the figure above. What is the total damage imposed as a
result of producing...
Refer to the figure below. If the firm is producing the level of output that maximizes profit, its total variable c...
 Refer to the figure below. If the firm is producing the level of output that maximizes profit, its total variable cost of production is: Price (s) MC1 Fatci AVC NA MRID 10 20 30 40 50 60 70 80 90 Quantity $240 $420 $360 $160
Refer to the information provided in Figure 8.6 below to answer the questions that follow. Cost...
 Refer to the information provided in Figure 8.6 below to answer the questions that follow. Cost curves for Outdoor Equipment 1 B 3 Cost per unit 2 A Number of sleeping bags 9 Figure 8.6 Refer to Figure 8.6. Curve 1 is Outdoor Equipment's cost curve. average variable marginal average fixed average total Refer to the information provided in Figure 13.9 below to answer the questions that follow. $A A G B Dollars E C MC = AC D MR...
27 2$ Refer to the diagram below. Price $13 Domestic Supply 00 $1.00 Tarih ) un...
 27 2$ Refer to the diagram below. Price $13 Domestic Supply 00 $1.00 Tarih ) un World Price Domestic Demand 30 40 60 84 96 Quantity Assuming that an import quota is given to foreign producers for free. What would be the total revenue received by foreign producers if an import quota is imposed instead of a $1 per unit tariff? 00 $1.00 Tariff 10 World Price Domestic Demand 30 40 60 84 96 Quantity Assuming that an import quota...
6 of 17 Refer to the figure below. If the firm is producing the level of...
 6 of 17 Refer to the figure below. If the firm is producing the level of output that maximizes profit, its total variable cost of production is (Hint: after finding the profit-maximizing point, you are looking for an area created by the average variable cost curve) Price ($) 18 16 MC1 14 12 10 ATC: 8 6 AVC1 4 का a 2 MR Di 10 20 30 40 50 60 70 80 90 Quantity $240 $360 $420 S160
1. Refer to Figure 1-5. The figure above represents demand and supply in the market for...
 1. Refer to Figure 1-5. The figure above represents demand and
supply in the market for cigarettes. Use the diagram to answer the
following questions.
a. How much is the government tax on each pack of
cigarettes?
b. What portion of the unit tax is paid by consumers?
c. What portion of the unit tax is paid by producers?
d. What is the quantity sold after the imposition of the
tax?
e. What is the after-tax revenue per pack received...
1. Refer to Figure 1-5. The figure above represents demand and
supply in the market for cigarettes. Use the diagram to answer the
following questions.
a. How much is the government tax on each pack of
cigarettes?
b. What portion of the unit tax is paid by consumers?
c. What portion of the unit tax is paid by producers?
d. What is the quantity sold after the imposition of the
tax?
e. What is the after-tax revenue per pack received...
Refer to the graph below. What price should the firm charge in order to maximize profits?...
 Refer to the graph below. What price should the firm charge in order to maximize profits? P 1 $70 I -1.J.-L III $60 $50 $40 $30 ור-זי N-T 1 I MC.. 1 $20 0 HT 1---T $10 --רוז--ו--י-ז-יח 1 1 1 1 1 + MR ----De 50 100 150 200 250 300 350 400 450 500 550 1 1
29. The following figure shows the demand curve faced by a monopolist. Refer to the figure...
29. The following figure shows the demand curve faced by a monopolist. Refer to the figure above. What is the change in total revenue due to a price decrease from $4 to $3? a. Total revenue decreases by $200. b. Total revenue increases by $100. c. Total revenue decreases by $100. d. Total revenue dinreases by $200. 30. Which of the following is true of an increase in product prices? a. When the quantity effect dominates the price effect, total...
The following is a total cost curve. 1000, Total cost ($) 0 50 100 150 200...
 The following is a total cost curve. 1000, Total cost ($) 0 50 100 150 200 250 300 350 Quantity (9) On the diagram to the right, sketch the corresponding marginal cost curve. Marginal cost per unit ($) Using the multipoint curved line drawing tool, draw the firm's marginal cost curve. Label this curve 'MC'. Note: Use the multipoint curved line drawing tool one time to draw the entire curve. If the price of output is $3.00 and there are...
Refer to the table above. Suppose the government wants to reduce the total amount of pollution...
 Refer to the table above. Suppose the government wants to reduce
the total amount of pollution from the current level of 10 to 4. To
do this, the government caps each firm's emissions at 2 units and
issues 2 permits to each firm. If firms are not allowed to trade
permits, what is the total cost of the pollution reduction?
Question 1 1 pts Table 16.3 Firm A Firm A Firm B Firm B Reduction of Pollution by Firm A...
Refer to the table above. Suppose the government wants to reduce
the total amount of pollution from the current level of 10 to 4. To
do this, the government caps each firm's emissions at 2 units and
issues 2 permits to each firm. If firms are not allowed to trade
permits, what is the total cost of the pollution reduction?
Question 1 1 pts Table 16.3 Firm A Firm A Firm B Firm B Reduction of Pollution by Firm A...
The graph is below. 6. Refer to Figure 15-6. What area measures the monopolist’s profit? (K-C)*W (L-A)*T (K-B)*W 0.5[(K-C)*(Z-T)] download?verifier=kMtVtwZuG9vNA64o3Itl3r 20. Scenario 15-3 A monopoly firm maximizes its profit by producing Q = 500
 The graph is below.6.Refer to Figure 15-6. What area measures the
monopolist’s profit?(K-C)*W(L-A)*T(K-B)*W0.5[(K-C)*(Z-T)]20.Scenario 15-3A monopoly firm maximizes its profit by producing Q = 500 units of
output. At that level of output, its marginal revenue is $30, its
average revenue is $60, and its average total cost is $34.Refer to Scenario 15-3. At Q = 500, the firm's
profit is-$13,000.-$15,000.-$17,000.-$30,000.21.21. Refer to Figure 15-9. To maximize total
surplus, a benevolent social planner would choose which of the
following outcomes?-100 units...
The graph is below.6.Refer to Figure 15-6. What area measures the
monopolist’s profit?(K-C)*W(L-A)*T(K-B)*W0.5[(K-C)*(Z-T)]20.Scenario 15-3A monopoly firm maximizes its profit by producing Q = 500 units of
output. At that level of output, its marginal revenue is $30, its
average revenue is $60, and its average total cost is $34.Refer to Scenario 15-3. At Q = 500, the firm's
profit is-$13,000.-$15,000.-$17,000.-$30,000.21.21. Refer to Figure 15-9. To maximize total
surplus, a benevolent social planner would choose which of the
following outcomes?-100 units...
 Refer to the figure below. If the firm is producing the level of output that maximizes profit, its total variable cost of production is: Price (s) MC1 Fatci AVC NA MRID 10 20 30 40 50 60 70 80 90 Quantity $240 $420 $360 $160
 Refer to the information provided in Figure 8.6 below to answer the questions that follow. Cost curves for Outdoor Equipment 1 B 3 Cost per unit 2 A Number of sleeping bags 9 Figure 8.6 Refer to Figure 8.6. Curve 1 is Outdoor Equipment's cost curve. average variable marginal average fixed average total Refer to the information provided in Figure 13.9 below to answer the questions that follow. $A A G B Dollars E C MC = AC D MR...
 27 2$ Refer to the diagram below. Price $13 Domestic Supply 00 $1.00 Tarih ) un World Price Domestic Demand 30 40 60 84 96 Quantity Assuming that an import quota is given to foreign producers for free. What would be the total revenue received by foreign producers if an import quota is imposed instead of a $1 per unit tariff? 00 $1.00 Tariff 10 World Price Domestic Demand 30 40 60 84 96 Quantity Assuming that an import quota...
 6 of 17 Refer to the figure below. If the firm is producing the level of output that maximizes profit, its total variable cost of production is (Hint: after finding the profit-maximizing point, you are looking for an area created by the average variable cost curve) Price ($) 18 16 MC1 14 12 10 ATC: 8 6 AVC1 4 का a 2 MR Di 10 20 30 40 50 60 70 80 90 Quantity $240 $360 $420 S160
 1. Refer to Figure 1-5. The figure above represents demand and
supply in the market for cigarettes. Use the diagram to answer the
following questions.
a. How much is the government tax on each pack of
cigarettes?
b. What portion of the unit tax is paid by consumers?
c. What portion of the unit tax is paid by producers?
d. What is the quantity sold after the imposition of the
tax?
e. What is the after-tax revenue per pack received...
1. Refer to Figure 1-5. The figure above represents demand and
supply in the market for cigarettes. Use the diagram to answer the
following questions.
a. How much is the government tax on each pack of
cigarettes?
b. What portion of the unit tax is paid by consumers?
c. What portion of the unit tax is paid by producers?
d. What is the quantity sold after the imposition of the
tax?
e. What is the after-tax revenue per pack received...
 Refer to the graph below. What price should the firm charge in order to maximize profits? P 1 $70 I -1.J.-L III $60 $50 $40 $30 ור-זי N-T 1 I MC.. 1 $20 0 HT 1---T $10 --רוז--ו--י-ז-יח 1 1 1 1 1 + MR ----De 50 100 150 200 250 300 350 400 450 500 550 1 1
 The following is a total cost curve. 1000, Total cost ($) 0 50 100 150 200 250 300 350 Quantity (9) On the diagram to the right, sketch the corresponding marginal cost curve. Marginal cost per unit ($) Using the multipoint curved line drawing tool, draw the firm's marginal cost curve. Label this curve 'MC'. Note: Use the multipoint curved line drawing tool one time to draw the entire curve. If the price of output is $3.00 and there are...
 Refer to the table above. Suppose the government wants to reduce
the total amount of pollution from the current level of 10 to 4. To
do this, the government caps each firm's emissions at 2 units and
issues 2 permits to each firm. If firms are not allowed to trade
permits, what is the total cost of the pollution reduction?
Question 1 1 pts Table 16.3 Firm A Firm A Firm B Firm B Reduction of Pollution by Firm A...
Refer to the table above. Suppose the government wants to reduce
the total amount of pollution from the current level of 10 to 4. To
do this, the government caps each firm's emissions at 2 units and
issues 2 permits to each firm. If firms are not allowed to trade
permits, what is the total cost of the pollution reduction?
Question 1 1 pts Table 16.3 Firm A Firm A Firm B Firm B Reduction of Pollution by Firm A...
 The graph is below.6.Refer to Figure 15-6. What area measures the
monopolist’s profit?(K-C)*W(L-A)*T(K-B)*W0.5[(K-C)*(Z-T)]20.Scenario 15-3A monopoly firm maximizes its profit by producing Q = 500 units of
output. At that level of output, its marginal revenue is $30, its
average revenue is $60, and its average total cost is $34.Refer to Scenario 15-3. At Q = 500, the firm's
profit is-$13,000.-$15,000.-$17,000.-$30,000.21.21. Refer to Figure 15-9. To maximize total
surplus, a benevolent social planner would choose which of the
following outcomes?-100 units...
The graph is below.6.Refer to Figure 15-6. What area measures the
monopolist’s profit?(K-C)*W(L-A)*T(K-B)*W0.5[(K-C)*(Z-T)]20.Scenario 15-3A monopoly firm maximizes its profit by producing Q = 500 units of
output. At that level of output, its marginal revenue is $30, its
average revenue is $60, and its average total cost is $34.Refer to Scenario 15-3. At Q = 500, the firm's
profit is-$13,000.-$15,000.-$17,000.-$30,000.21.21. Refer to Figure 15-9. To maximize total
surplus, a benevolent social planner would choose which of the
following outcomes?-100 units...
Most questions answered within 3 hours.
-
What is the pH of the solution that results of dissolving 1.74g
of sodium hydroxide in...
asked 1 minute ago -
Given a standardized normal distribution (with μ = 0 and a σ =
1), what is...
asked 39 minutes ago -
Given the following information:
acetic acid
CH3COOH
Ka = 1.8×10⁻⁵
triethylamine
(C2H5)3N
Kb = 5.2×10⁻⁴
(1)...
asked 25 minutes ago -
Potassium permanganate(KMNO4)is has a solubility of 6.4 g/ 100 g
of water at 20ºC, and 250...
asked 22 minutes ago -
51.
As the marginal propensity to expend rises, the multiplier:
decreases.
is impossible to determine.
increases....
asked 28 minutes ago -
The Baldwin Company currently has the following balances on their
balance sheet:
Total
Liabilities
$69,309
Common...
asked 31 minutes ago -
A quiet town in Kansas has 10 people, all of whom have the same
preferences. There...
asked 37 minutes ago -
Summarize what an organization needs from a leader.
a. Analyze what might happen to an organization...
asked 39 minutes ago -
How would one critically evaluate an organizations marketing
strategies from the viewpoint of its consumers, as...
asked 38 minutes ago -
Company XYZ know that replacement times for the quartz time
pieces it produces are normally distributed...
asked 53 minutes ago -
A) Write the acid-base reaction that occurs between Na2HPO4 and
NaOH
B) Write the possible reactions...
asked 1 hour ago -
What advantages does the Natural Law Theory have in comparison
with the Divine Command Theory? Explain...
asked 1 hour ago