
Homework Answers
Add Answer to:
The following diagram shows supply and demand in the market for laptops. Demand PRICE (Dollars per...
The following diagram shows supply and demand in the market for laptops. 150 Demand PRICE (Dollars...
 The following diagram shows supply and demand in the market for laptops. 150 Demand PRICE (Dollars per laptop) Supply 0 Fttttt 0 35 70 105 140 175 210 245 280 QUANTITY (Millions of laptops) 315 350 Suppose the government enacts a Price Ceiling of Pc = $45. Fill in the following table with integer values: Values With Pc = $45 Change From Original Equilibrium Equilibrium Price Equilibrium Quantity Consumer Surplus Producer Surplus Total Surplus Deadweight Loss
11. Total welfare The following graph shows supply and demand in the market for smartphones Use...
 11. Total welfare The following graph shows supply and demand in the market for smartphones Use the black point (cross symbol) to indicate the equilibrium price and quantity of smartphones. Then use the green point (triangle symbol) to fill the area representing consumer surplus, and use the purple point (diamond symbol) to fill the area representing producer surplus 250 Demand 225 Equilbrium 200 175 Consumer Surplus 150 125 Producer Surplus 100 75 50 25 Supply 0 280 350 175 210...
3. Consumer Surplus and Producer Surplus from Market Exchange Consider the Zambian market for ora...
 3. Consumer Surplus and Producer Surplus from Market
Exchange
Consider the Zambian market for oranges.
The following graph shows the domestic demand and domestic
supply curves for oranges in Zambia. Suppose Zambia's government
currently does not allow the international trade in oranges.
Use the black point (plus symbol) to indicate the equilibrium
price of a ton of oranges and the equilibrium quantity of oranges
in Zambia in the absence of international trade. Then, use the
green point (triangle symbol) to...
3. Consumer Surplus and Producer Surplus from Market
Exchange
Consider the Zambian market for oranges.
The following graph shows the domestic demand and domestic
supply curves for oranges in Zambia. Suppose Zambia's government
currently does not allow the international trade in oranges.
Use the black point (plus symbol) to indicate the equilibrium
price of a ton of oranges and the equilibrium quantity of oranges
in Zambia in the absence of international trade. Then, use the
green point (triangle symbol) to...
8. Total economie surplus The following diagram shows supply and demand in the market for smartphones...
 8. Total economie surplus The following diagram shows supply and demand in the market for smartphones Use the black point (plus symbol) to indl the equilibrium price and quantity of smartphones. Then use the green point (triangle symbol) to fill area representing consumer surplus, and use the purple point (diamond symbol) to fill the area representing producer surplus. Demand Equilibrium Consumer Surplus PRICE (Dollars per phone) Producer Surplus 0 40 320 350 400 80 120 160 200 240 280 QUANTITY (Millions of phones)...
Consider the market for mountain bikes. The following graph shows the demand and supply for mountain...
 Consider the market for mountain bikes. The following graph shows the demand and supply for mountain bikes before the government imposes any taxes. First, use the black point (plus symbol) to indicate the equilbrium price and quantity of mountain bikes in the absence of a tex. Then use the green point (triangle symbol) to shade the area representing total consumer surplus (CS) at the equilbrium price. Next, use the purple point (dlamond symbol) to shade the area representing total producer...
Total economic surplus. The following diagram shows supply and demand in the market for smart phones....
 Total economic surplus.
The following diagram shows supply and demand in the market for
smart phones.
Use the black point (plus symbol) to indicate the equilibrium
price and quantity of smart phones. Then use the green point
(triangle symbol) to fill the area representing consumer surplus,
and use the purple point (diamond symbol) to fill the area
representing producer surplus.
Total surplus in this market is ($
)million.
150 135 Demand Equilibrium 120 105 5 90 2 75 Consumer Surplus...
Total economic surplus.
The following diagram shows supply and demand in the market for
smart phones.
Use the black point (plus symbol) to indicate the equilibrium
price and quantity of smart phones. Then use the green point
(triangle symbol) to fill the area representing consumer surplus,
and use the purple point (diamond symbol) to fill the area
representing producer surplus.
Total surplus in this market is ($
)million.
150 135 Demand Equilibrium 120 105 5 90 2 75 Consumer Surplus...
Total economic surplus The following diagram shows supply and demand in the market for smartphones. Use...
 Total economic surplus The following diagram shows supply and
demand in the market for smartphones. Use the black point (plus
symbol) to indicate the equilibrium price and quantity of
smartphones. Then use the green point (triangle symbol) to fill the
area representing consumer surplus, and use the purple point
(diamond symbol) to fill the area representing producer
surplus.
8. Total economic surplus The following diagram shows supply and demand in the market for smartphones. Use the black point (plus symbol)...
Total economic surplus The following diagram shows supply and
demand in the market for smartphones. Use the black point (plus
symbol) to indicate the equilibrium price and quantity of
smartphones. Then use the green point (triangle symbol) to fill the
area representing consumer surplus, and use the purple point
(diamond symbol) to fill the area representing producer
surplus.
8. Total economic surplus The following diagram shows supply and demand in the market for smartphones. Use the black point (plus symbol)...
Consider the Colombian market for soybeans. The following graph shows the domestic demand and domestic supply...
 Consider the Colombian market for soybeans. The following graph shows the domestic demand and domestic supply curves for soybeans in Colombia. Suppose Colombia's government currently does not allow international trade in soybeans. Use the black point (plus symbol) to indicate the equilibrium price of a ton of soybeans and the equilibrium quantity of soybeans in Colombia in the absence of international trade. Then, use the green triangle (triangle symbol) to shade the area representing consumer surplus in equilibrium. Finally, use...
Consider a market with demand and supply functions: Supply function: ? = 40? − 40 Demand...
Consider a market with demand and supply functions: Supply function: ? = 40? − 40 Demand function: ? = 200 − 20? a. Draw the demand-supply curves. Find equilibrium price and quantity. Find consumer surplus, producer surplus, and total surplus in the graph. b. Calculate exact size of consumer surplus, producer surplus, and total surplus, respectively. Welfare effects of a price control. The government sets a price floor at $5. c. Find the market price and quantity traded, and the...
11. Total welfare The following graph shows supply and demand in the market for computer keyboards....
 11. Total welfare The following graph shows supply and demand in the market for computer keyboards. Use the black point (cross symbol) to indicate the equilibrium price and quantity of computer keyboards. Then use the green point (triangle symbol) to fill the area representing consumer surplus, and use the purple point (diamond symbol) to fill the area representing producer surplus. Demand Equilibrium A Consumer Surplus PRICE (Dollars per keyboard) Producer Surplus Supply 0 10 90 100 20 30 40 50...
 The following diagram shows supply and demand in the market for laptops. 150 Demand PRICE (Dollars per laptop) Supply 0 Fttttt 0 35 70 105 140 175 210 245 280 QUANTITY (Millions of laptops) 315 350 Suppose the government enacts a Price Ceiling of Pc = $45. Fill in the following table with integer values: Values With Pc = $45 Change From Original Equilibrium Equilibrium Price Equilibrium Quantity Consumer Surplus Producer Surplus Total Surplus Deadweight Loss
 11. Total welfare The following graph shows supply and demand in the market for smartphones Use the black point (cross symbol) to indicate the equilibrium price and quantity of smartphones. Then use the green point (triangle symbol) to fill the area representing consumer surplus, and use the purple point (diamond symbol) to fill the area representing producer surplus 250 Demand 225 Equilbrium 200 175 Consumer Surplus 150 125 Producer Surplus 100 75 50 25 Supply 0 280 350 175 210...
 3. Consumer Surplus and Producer Surplus from Market
Exchange
Consider the Zambian market for oranges.
The following graph shows the domestic demand and domestic
supply curves for oranges in Zambia. Suppose Zambia's government
currently does not allow the international trade in oranges.
Use the black point (plus symbol) to indicate the equilibrium
price of a ton of oranges and the equilibrium quantity of oranges
in Zambia in the absence of international trade. Then, use the
green point (triangle symbol) to...
3. Consumer Surplus and Producer Surplus from Market
Exchange
Consider the Zambian market for oranges.
The following graph shows the domestic demand and domestic
supply curves for oranges in Zambia. Suppose Zambia's government
currently does not allow the international trade in oranges.
Use the black point (plus symbol) to indicate the equilibrium
price of a ton of oranges and the equilibrium quantity of oranges
in Zambia in the absence of international trade. Then, use the
green point (triangle symbol) to...
 8. Total economie surplus The following diagram shows supply and demand in the market for smartphones Use the black point (plus symbol) to indl the equilibrium price and quantity of smartphones. Then use the green point (triangle symbol) to fill area representing consumer surplus, and use the purple point (diamond symbol) to fill the area representing producer surplus. Demand Equilibrium Consumer Surplus PRICE (Dollars per phone) Producer Surplus 0 40 320 350 400 80 120 160 200 240 280 QUANTITY (Millions of phones)...
 Consider the market for mountain bikes. The following graph shows the demand and supply for mountain bikes before the government imposes any taxes. First, use the black point (plus symbol) to indicate the equilbrium price and quantity of mountain bikes in the absence of a tex. Then use the green point (triangle symbol) to shade the area representing total consumer surplus (CS) at the equilbrium price. Next, use the purple point (dlamond symbol) to shade the area representing total producer...
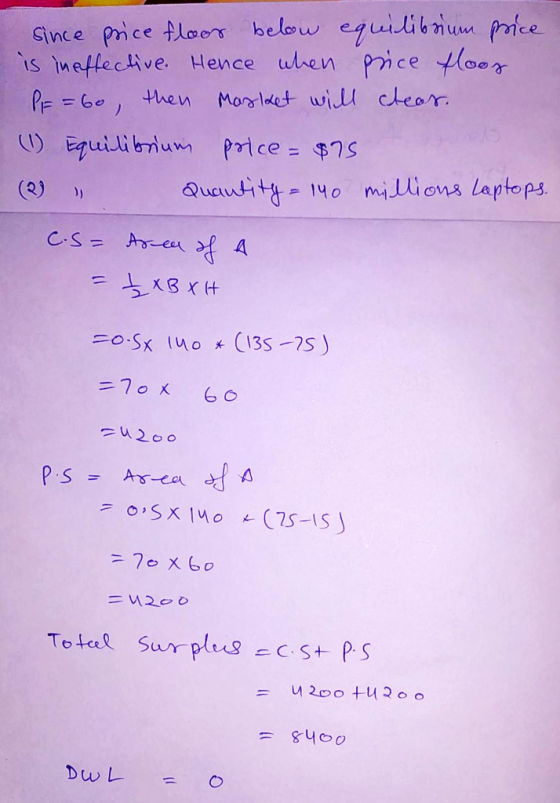
 Total economic surplus.
The following diagram shows supply and demand in the market for
smart phones.
Use the black point (plus symbol) to indicate the equilibrium
price and quantity of smart phones. Then use the green point
(triangle symbol) to fill the area representing consumer surplus,
and use the purple point (diamond symbol) to fill the area
representing producer surplus.
Total surplus in this market is ($
)million.
150 135 Demand Equilibrium 120 105 5 90 2 75 Consumer Surplus...
Total economic surplus.
The following diagram shows supply and demand in the market for
smart phones.
Use the black point (plus symbol) to indicate the equilibrium
price and quantity of smart phones. Then use the green point
(triangle symbol) to fill the area representing consumer surplus,
and use the purple point (diamond symbol) to fill the area
representing producer surplus.
Total surplus in this market is ($
)million.
150 135 Demand Equilibrium 120 105 5 90 2 75 Consumer Surplus...
 Total economic surplus The following diagram shows supply and
demand in the market for smartphones. Use the black point (plus
symbol) to indicate the equilibrium price and quantity of
smartphones. Then use the green point (triangle symbol) to fill the
area representing consumer surplus, and use the purple point
(diamond symbol) to fill the area representing producer
surplus.
8. Total economic surplus The following diagram shows supply and demand in the market for smartphones. Use the black point (plus symbol)...
Total economic surplus The following diagram shows supply and
demand in the market for smartphones. Use the black point (plus
symbol) to indicate the equilibrium price and quantity of
smartphones. Then use the green point (triangle symbol) to fill the
area representing consumer surplus, and use the purple point
(diamond symbol) to fill the area representing producer
surplus.
8. Total economic surplus The following diagram shows supply and demand in the market for smartphones. Use the black point (plus symbol)...
 Consider the Colombian market for soybeans. The following graph shows the domestic demand and domestic supply curves for soybeans in Colombia. Suppose Colombia's government currently does not allow international trade in soybeans. Use the black point (plus symbol) to indicate the equilibrium price of a ton of soybeans and the equilibrium quantity of soybeans in Colombia in the absence of international trade. Then, use the green triangle (triangle symbol) to shade the area representing consumer surplus in equilibrium. Finally, use...
 11. Total welfare The following graph shows supply and demand in the market for computer keyboards. Use the black point (cross symbol) to indicate the equilibrium price and quantity of computer keyboards. Then use the green point (triangle symbol) to fill the area representing consumer surplus, and use the purple point (diamond symbol) to fill the area representing producer surplus. Demand Equilibrium A Consumer Surplus PRICE (Dollars per keyboard) Producer Surplus Supply 0 10 90 100 20 30 40 50...
Most questions answered within 3 hours.
-
Lower Equitorial and Upper Equitorial are the same except Lower
Equitorial has a larger capital stock....
asked 1 minute ago -
how do you think that pH of a jar where you have added a certain
amount...
asked 11 minutes ago -
If the Federal Reserve increases the reserve requirement, what
will happen to the Money Supply in...
asked 6 minutes ago -
Suppose that market demand for a good is given by Q = 9 - 0.3 P...
asked 12 minutes ago -
two thin lenses are separated by a distance x. The first lens
has a focal length...
asked 13 minutes ago -
The computer that controls a bank's automatic teller machine
crashes a mean of 0.6 times per...
asked 17 minutes ago -
`1) How is -9 (base 10) represented in 8-bit two's complement
notation?
a) 00001001
b)11110111
c)11110110...
asked 27 minutes ago -
A 10.000 g sample of water contains 11.19% H by mass. what
should be the %H...
asked 44 minutes ago -
Consider an investment game among 2 players. Each player can
either invest,
i, or not invest,-i....
asked 42 minutes ago -
The time taken to complete a particular task is normally
distributed with a standard deviation of...
asked 52 minutes ago -
we have heteroskedasticity in a regression when:
When the variance of error terms changes when an...
asked 1 hour ago -
Explain some different types of fungi. State the different
divisions undergo by fungi.
asked 1 hour ago