![Part 3 [35 Marks 3- The number of nonconforming switches in samples of size 75 are shown in Table 3. [20 Marks] Table 3 Numbe](http://img.homeworklib.com/images/cf8f9fc0-67f6-4e2c-8cd8-b755a8073f2a.png?x-oss-process=image/resize,w_560)

(b) What is the smallest sample size that could be used for this process and still give a positive lower control limit on the chart? [S Marks]
Homework Answers

Add Answer to:
Part 3 [35 Marks 3- The number of nonconforming switches in samples of size 75 are...
2- The number of nonconforming switches in Number of Number of samples of size 150 are...
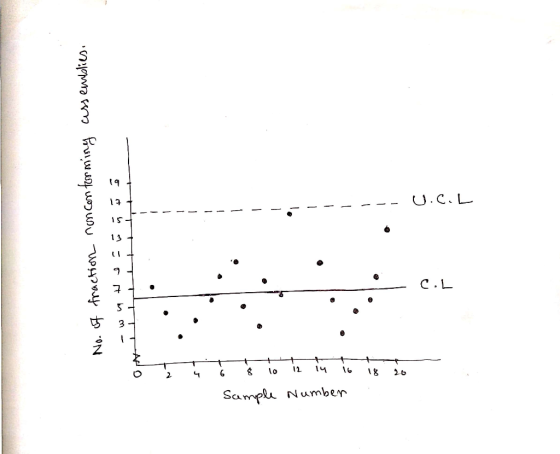
 2- The number of nonconforming switches in Number of Number of samples of size 150 are shown in the Table. Sample Construct a fraction nonconforming control chart (p-chart) for these data. Does the process appear to be in control? If not assume that assignable causes can be found 4 for all points outside the control limits and calculate the revised control limits. Nonconforming Switches Sample Number Nonconforniro Switches Number 12 13 14 15 16 17 18 19 0 15 10
Chapter 7 Table below contains data on examination of medical insurance claims. Every day 50 claims...
Chapter 7 Table below contains data on examination of medical insurance claims. Every day 50 claims were examined. Day Number Nonconforming 1 0 2 3 3 4 4 6 5 5 6 2 7 8 8 9 9 4 10 2 11 6 12 4 13 8 14 0 15 7 16 20 17 6 18 1 19 5 20 7 Set up the fraction nonconforming control chart (p-chart) for this process. Plot the preliminary data in the above table...
Assignment #7 Question 3 The dats found in the table below ghe the number of non-conformirg beari...
 Assignment #7 Question 3 The dats found in the table below ghe the number of non-conformirg bearing and seal assemblies in samples of n 100 Construct a fraction nonconforming control chart for these p-chart f any point plot out ef control, assume that assignable causes can be found and determine the revised control Imits. Nusber of
Assignment #7 Question 3 The dats found in the table below ghe the number of non-conformirg bearing and seal assemblies in samples of n...
Assignment #7 Question 3 The dats found in the table below ghe the number of non-conformirg bearing and seal assemblies in samples of n 100 Construct a fraction nonconforming control chart for these p-chart f any point plot out ef control, assume that assignable causes can be found and determine the revised control Imits. Nusber of
Assignment #7 Question 3 The dats found in the table below ghe the number of non-conformirg bearing and seal assemblies in samples of n...
2. (20 points) A controlled through the use of a fraction nonconforming chart. Initially, one sample of size taken each day for 10 days, and the results shown in following table are observed. (a)...
 2. (20 points) A controlled through the use of a fraction nonconforming chart. Initially, one sample of size taken each day for 10 days, and the results shown in following table are observed. (a) Establish a control chart to monitor future production. (b) Apply Western Electric Rules to these charts. Is the process in statistical control? process that produces titanium forgings for automobile turbocharger wheels is to be 200 i Day Nonconforming Units 14 15 6 7 8 14 5...
5. The bearing manufacturing company wants to stablish a proportion of nonconforming control char...
 quality control
5. The bearing manufacturing company wants to stablish a proportion of nonconforming control chart for the ball bearing ball diameters. After taking 20 samples of size 100 each, the total number of nonconforming found was 110. Find the center line and the upper and lower limits of a control chart for the fraction of nonconforming for this process
5. The bearing manufacturing company wants to stablish a proportion of nonconforming control chart for the ball bearing ball diameters....
quality control
5. The bearing manufacturing company wants to stablish a proportion of nonconforming control chart for the ball bearing ball diameters. After taking 20 samples of size 100 each, the total number of nonconforming found was 110. Find the center line and the upper and lower limits of a control chart for the fraction of nonconforming for this process
5. The bearing manufacturing company wants to stablish a proportion of nonconforming control chart for the ball bearing ball diameters....
part c Below table contains data on examination of medical insurance claims. Every day 50 claims...
 part c
Below table contains data on examination of medical insurance claims. Every day 50 claims were examined. Medical Insurance Claim Data Day Number Nonconforming Day Number Nonconforming 2 4 6 14 22 55 1151 62 1620 7 170 8 HT a) (15 points) Set up the fraction nonconforming control chart for this process. Plot the preliminary data in table on the chart. Is the process in statistical control? b) (10 points] Assume that assignable causes can be found for...
part c
Below table contains data on examination of medical insurance claims. Every day 50 claims were examined. Medical Insurance Claim Data Day Number Nonconforming Day Number Nonconforming 2 4 6 14 22 55 1151 62 1620 7 170 8 HT a) (15 points) Set up the fraction nonconforming control chart for this process. Plot the preliminary data in table on the chart. Is the process in statistical control? b) (10 points] Assume that assignable causes can be found for...
2- A process is controlled with a fraction nonconforming control chart with 3-sigma limits, n-100, UCL=0.161,...
 2- A process is controlled with a fraction nonconforming control chart with 3-sigma limits, n-100, UCL=0.161, CL:0.08, and LCL=0·Find the equivalent control chart for the number nonconforming.
04)- 244+3-15 marás) Control charts for X and R are mairnt S marks) Contr ol charts for X and R are maintained for quality characteristic. The and R are computed for each sample. After 30 samples,...
 04)- 244+3-15 marás) Control charts for X and R are mairnt S marks) Contr ol charts for X and R are maintained for quality characteristic. The and R are computed for each sample. After 30 samples, the following a computed: 6690 R-1030 a- What are the tria Ilimits for the R chart ? tb) Assuming that the R chart is in control, what are the trial limits for the X char? Estimate the process mean and standard devintion. (d- Ifthe...
Question 4 [20 marks] By utilising Annexure A, answer the following questions: (a) 15 samples of...
 Question 4 [20 marks] By utilising Annexure A, answer the following questions: (a) 15 samples of n 8 have been taken from a cleaning operation. The average sample range for the 20 samples was 0.016 minute, and the average mean was 3 minutes. Determine the three-sigma control limits for this process. (4 marks) (b) 15 samples of n 10 observations have been taken from a milling process. The average sample range is 0.01 centimetres. Determine upper and lower control limits...
Using Minitab, solve the following problem. A process that produces parts for auto-mobile turbocharger wheels is...
Using Minitab, solve the following problem. A process that produces parts for auto-mobile turbocharger wheels is to be controlled though the use of a fraction nonconforming chart. Initially, one sample of size 100 is taken each day for 20 days, and the results shown in table are observed Day Nonconforming units Day Nonconforming units 1 3 11 2 2 2 12 4 3 4 13 1 4 2 14 3 5 5 15 6 6 2 16 0 7 1...
 2- The number of nonconforming switches in Number of Number of samples of size 150 are shown in the Table. Sample Construct a fraction nonconforming control chart (p-chart) for these data. Does the process appear to be in control? If not assume that assignable causes can be found 4 for all points outside the control limits and calculate the revised control limits. Nonconforming Switches Sample Number Nonconforniro Switches Number 12 13 14 15 16 17 18 19 0 15 10
 Assignment #7 Question 3 The dats found in the table below ghe the number of non-conformirg bearing and seal assemblies in samples of n 100 Construct a fraction nonconforming control chart for these p-chart f any point plot out ef control, assume that assignable causes can be found and determine the revised control Imits. Nusber of
Assignment #7 Question 3 The dats found in the table below ghe the number of non-conformirg bearing and seal assemblies in samples of n...
Assignment #7 Question 3 The dats found in the table below ghe the number of non-conformirg bearing and seal assemblies in samples of n 100 Construct a fraction nonconforming control chart for these p-chart f any point plot out ef control, assume that assignable causes can be found and determine the revised control Imits. Nusber of
Assignment #7 Question 3 The dats found in the table below ghe the number of non-conformirg bearing and seal assemblies in samples of n...
 2. (20 points) A controlled through the use of a fraction nonconforming chart. Initially, one sample of size taken each day for 10 days, and the results shown in following table are observed. (a) Establish a control chart to monitor future production. (b) Apply Western Electric Rules to these charts. Is the process in statistical control? process that produces titanium forgings for automobile turbocharger wheels is to be 200 i Day Nonconforming Units 14 15 6 7 8 14 5...
 quality control
5. The bearing manufacturing company wants to stablish a proportion of nonconforming control chart for the ball bearing ball diameters. After taking 20 samples of size 100 each, the total number of nonconforming found was 110. Find the center line and the upper and lower limits of a control chart for the fraction of nonconforming for this process
5. The bearing manufacturing company wants to stablish a proportion of nonconforming control chart for the ball bearing ball diameters....
quality control
5. The bearing manufacturing company wants to stablish a proportion of nonconforming control chart for the ball bearing ball diameters. After taking 20 samples of size 100 each, the total number of nonconforming found was 110. Find the center line and the upper and lower limits of a control chart for the fraction of nonconforming for this process
5. The bearing manufacturing company wants to stablish a proportion of nonconforming control chart for the ball bearing ball diameters....
 part c
Below table contains data on examination of medical insurance claims. Every day 50 claims were examined. Medical Insurance Claim Data Day Number Nonconforming Day Number Nonconforming 2 4 6 14 22 55 1151 62 1620 7 170 8 HT a) (15 points) Set up the fraction nonconforming control chart for this process. Plot the preliminary data in table on the chart. Is the process in statistical control? b) (10 points] Assume that assignable causes can be found for...
part c
Below table contains data on examination of medical insurance claims. Every day 50 claims were examined. Medical Insurance Claim Data Day Number Nonconforming Day Number Nonconforming 2 4 6 14 22 55 1151 62 1620 7 170 8 HT a) (15 points) Set up the fraction nonconforming control chart for this process. Plot the preliminary data in table on the chart. Is the process in statistical control? b) (10 points] Assume that assignable causes can be found for...
 2- A process is controlled with a fraction nonconforming control chart with 3-sigma limits, n-100, UCL=0.161, CL:0.08, and LCL=0·Find the equivalent control chart for the number nonconforming.
 04)- 244+3-15 marás) Control charts for X and R are mairnt S marks) Contr ol charts for X and R are maintained for quality characteristic. The and R are computed for each sample. After 30 samples, the following a computed: 6690 R-1030 a- What are the tria Ilimits for the R chart ? tb) Assuming that the R chart is in control, what are the trial limits for the X char? Estimate the process mean and standard devintion. (d- Ifthe...
 Question 4 [20 marks] By utilising Annexure A, answer the following questions: (a) 15 samples of n 8 have been taken from a cleaning operation. The average sample range for the 20 samples was 0.016 minute, and the average mean was 3 minutes. Determine the three-sigma control limits for this process. (4 marks) (b) 15 samples of n 10 observations have been taken from a milling process. The average sample range is 0.01 centimetres. Determine upper and lower control limits...
Most questions answered within 3 hours.
-
Suppose X follows an exponential distribution with mean 7.5.
Determine the conditional probability P(x > 2.5...
asked 1 minute ago -
Young softball batters are often instructed to “choke-up on the
bat” by their coach. In terms...
asked 4 minutes ago -
Suppose that you are an official with Mexico's economic
development agency. Write a one-page memo detailing...
asked 35 minutes ago -
If you were an international firm, why would you support the
concept of global free trade?...
asked 50 minutes ago -
Cisco packet tracer
Q1) Do you get any changes of IP address when packet is
traversing...
asked 1 hour ago -
What is the pressure inside a 33.0 L container holding 106.4 kg
of argon gas at...
asked 2 hours ago -
Question no 2
A housekeeping support department budgets its costs at
SR 40,000 per month plus...
asked 2 hours ago -
A 1400Kg sports car accelerates from rest to 90km/h in 7.0s.
What is the average power...
asked 3 hours ago -
For the following reaction, 0.128 moles of
potassium hydrogen sulfateare mixed with
0.504 moles of potassium...
asked 6 hours ago -
1. What is the present value of $400, three years in the future
if the interest...
asked 7 hours ago -
The labor force minus the number of employed equals the number
of unemployed.
a. True
b....
asked 9 hours ago -
Determine the mass in units of grams [g] of 0.49 moles [mol]
of a new fictitious...
asked 9 hours ago