
Homework Answers
 Note :- use normal
distribution table for reading of Area corresponding to Z values in
part d)
Note :- use normal
distribution table for reading of Area corresponding to Z values in
part d)
Add Answer to:
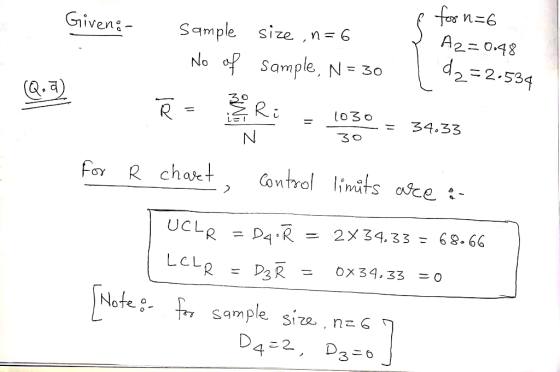
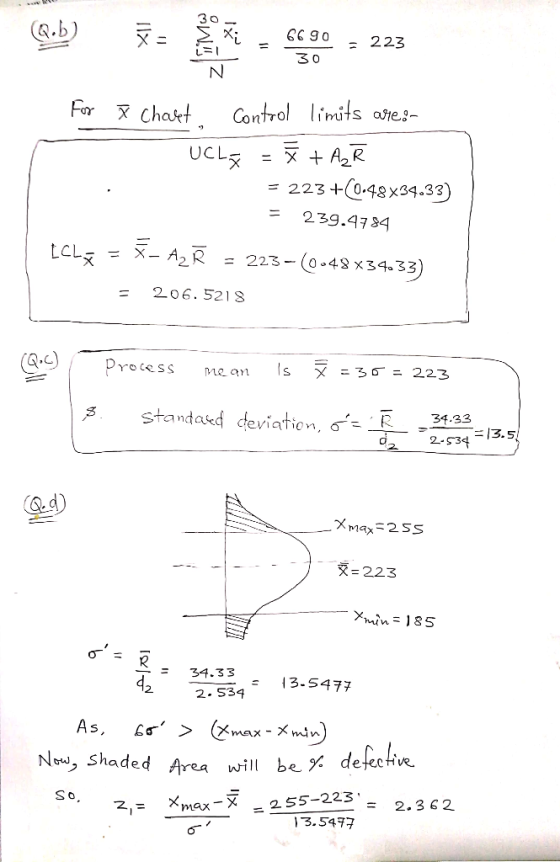
04)- 244+3-15 marás) Control charts for X and R are mairnt S marks) Contr ol charts for X and R are maintained for quality characteristic. The and R are computed for each sample. After 30 samples,...
Control charts for bar x chart and S have been maintained on a process and have...
 Control charts for bar x chart and S have been maintained on a process and have exhibited statistical control. The sample size is n=6. The control chart parameters are as follows: Estimate the mean and standard deviation of the process. Assume that the process output is well modeled by a normal distribution. If specifications are 703 and 709, estimate the fraction nonconforming. Suppose the process mean shifts to 702.00 while the standard deviation remains constant. What is the probability of...
Control charts for and R are to be set up for an important quality characteristic. The...
 Control charts for and R are to be set up for an important quality characteristic. The sample size is n 5, and X and r are computed for each of 35 preliminary samples. The summary data are: X,7802 and ,r 1180 Round your answers to 2 decimal places (e.g. 98.76). (a) Find trial control limits forand R charts. X Control Limits UCL- CL= LCL- 3. R Control Limits: UCL LCL = (b) Assuming that the pracess is in control, estimate...
Problem no.3 The thickness of a metal part is the quality characteristic that statistical process control...
 Problem no.3 The thickness of a metal part is the quality characteristic that statistical process control is being applied to. Measurements are taken from 25 subgroups of subgroup size 5. The sum of the X-bar values 1.5735. The sum of the R-values .0231. Xbar/R Chart for x 0636 06396 Subgroup 10 15 20 25 001 0011 a.) Calculate the trial control limits and centerlines for the X-bar and R charts above b.) Calculate the revised control limits and centerlines for...
Samples of n5 units are taken from a process every hour. The and R values for a particular quality char acteristic are determined. After 25 samples have been collected, we calculate 20 and R 4.56 (a)...
 Samples of n5 units are taken from a process every hour. The and R values for a particular quality char acteristic are determined. After 25 samples have been collected, we calculate 20 and R 4.56 (a) What are the three-sigma control limits for x and R? (b) Both charts exhibit control. Estimate the process standard deviation (c) Assume that the process output is normally dis- tributed. If the specifications are 19 t 5, what are your conclusions regarding the process...
 Control charts for bar x chart and S have been maintained on a process and have exhibited statistical control. The sample size is n=6. The control chart parameters are as follows: Estimate the mean and standard deviation of the process. Assume that the process output is well modeled by a normal distribution. If specifications are 703 and 709, estimate the fraction nonconforming. Suppose the process mean shifts to 702.00 while the standard deviation remains constant. What is the probability of...
 Control charts for and R are to be set up for an important quality characteristic. The sample size is n 5, and X and r are computed for each of 35 preliminary samples. The summary data are: X,7802 and ,r 1180 Round your answers to 2 decimal places (e.g. 98.76). (a) Find trial control limits forand R charts. X Control Limits UCL- CL= LCL- 3. R Control Limits: UCL LCL = (b) Assuming that the pracess is in control, estimate...
 Problem no.3 The thickness of a metal part is the quality characteristic that statistical process control is being applied to. Measurements are taken from 25 subgroups of subgroup size 5. The sum of the X-bar values 1.5735. The sum of the R-values .0231. Xbar/R Chart for x 0636 06396 Subgroup 10 15 20 25 001 0011 a.) Calculate the trial control limits and centerlines for the X-bar and R charts above b.) Calculate the revised control limits and centerlines for...
 Samples of n5 units are taken from a process every hour. The and R values for a particular quality char acteristic are determined. After 25 samples have been collected, we calculate 20 and R 4.56 (a) What are the three-sigma control limits for x and R? (b) Both charts exhibit control. Estimate the process standard deviation (c) Assume that the process output is normally dis- tributed. If the specifications are 19 t 5, what are your conclusions regarding the process...
Most questions answered within 3 hours.
-
The proportion of adult women in a certain geographical region
is approximately 51%. A marketing survey...
asked 4 seconds ago -
I am trying to answer a question that is asking why there was no
evidence of...
asked 10 minutes ago -
Power elecrtonics: buck converter?
Calculate and plot (via excel/MATLAB) the average V(out) of a
buck converter...
asked 11 minutes ago -
PLEASE USE PYTHON
training error should strictly decrease as the degree of the
hypothesis polynomials increases....
asked 16 minutes ago -
Using the Table and data below, create a procedure that accepts
product ID as a parameter...
asked 18 minutes ago -
Suppose X follows an exponential distribution with mean 7.5.
Determine the conditional probability P(x > 2.5...
asked 41 minutes ago -
Young softball batters are often instructed to “choke-up on the
bat” by their coach. In terms...
asked 44 minutes ago -
Suppose that you are an official with Mexico's economic
development agency. Write a one-page memo detailing...
asked 1 hour ago -
If you were an international firm, why would you support the
concept of global free trade?...
asked 1 hour ago -
Cisco packet tracer
Q1) Do you get any changes of IP address when packet is
traversing...
asked 2 hours ago -
What is the pressure inside a 33.0 L container holding 106.4 kg
of argon gas at...
asked 3 hours ago -
Question no 2
A housekeeping support department budgets its costs at
SR 40,000 per month plus...
asked 2 hours ago