
Homework Answers

Taking z-transform

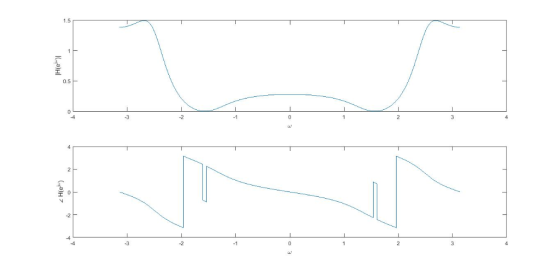
a)
w=-pi:0.001:pi;
z=exp(1i.*w);
H=(0.207+0.413.*z.^-2+0.207.*z.^-4)./(1+0.9051.*z.^-1+0.598.*z.^-2+0.29.*z.^-3+0.1958.*z.^-4);
subplot(211)
plot(w,abs(H));
xlabel('\omega');
ylabel('|H(e^{j\omega})|');
subplot(212)
plot(w,angle(H));
xlabel('\omega');
ylabel('\angle H(e^{j\omega})');
---------------
b)
N=100;
n1=0:N;
w1=0.25.*pi;
w2=0.45.*pi;
x1=4.*cos(w1.*n1-pi./6).*sin(w2.*n1+0.25.*pi);
x=[0 0 0 0 x1];
y=zeros(size(x));
for k=5:length(y)
y(k)=-0.9051.*y(k-1)-0.598.*y(k-2)-0.29.*y(k-3)-0.1958.*y(k-4)+0.207.*x(k)+0.413.*x(k-2)+0.207.*x(k-4);
end
n=-4:N;
stem(n,y);
hold on
stem(n,x);
hold off
xlabel('n');
legend('y(n)','x(n)');
--------------

------------------
c)


Now

and

therefore the steady state output for x(n) is


--------------
N=100;
n1=0:N;
w1=0.25.*pi;
w2=0.45.*pi;
x1=4.*cos(w1.*n1-pi./6).*sin(w2.*n1+0.25.*pi);
x=[0 0 0 0 x1];
y=zeros(size(x));
for k=5:length(y)
y(k)=-0.9051.*y(k-1)-0.598.*y(k-2)-0.29.*y(k-3)-0.1958.*y(k-4)+0.207.*x(k)+0.413.*x(k-2)+0.207.*x(k-4);
end
n=-4:N;
y1=1.05.*sin(0.7.*pi.*n1+2.9)+0.484.*sin(0.2.*pi.*n1+0.78);
ys=[0 0 0 0 y1];
stem(n,(y-ys))
hold on
stem(n,ys);
hold off
xlabel('n');
ylabel('y(n)=y_{s}(n)');
legend('transient response','steady state response');
-------------------

Add Answer to:
(5) For the system described by the following difference equation y(n)= 0.9051y(n 1) 0.598y(n 2) -0.29y(n...
matlab please matlab please (4) Consider the system described by the following difference equation y(n)1.77y(n-1)-0.81y(n 2)a(n)-...
 matlab please
(4) Consider the system described by the following difference equation y(n)1.77y(n-1)-0.81y(n 2)a(n)- 0.5(n -1) (a) Assuming a unit-step input, and using a long enough section of the input constant output y(n) is observed for large n, hence plot the output and determine the value of this constant called G so that a Note: G, y(n) for n0o. (b) Determine and plot the transient response given by: n(n) = y(n)- Go (c) Find the energy of the...
matlab please
matlab please
(4) Consider the system described by the following difference equation y(n)1.77y(n-1)-0.81y(n 2)a(n)- 0.5(n -1) (a) Assuming a unit-step input, and using a long enough section of the input constant output y(n) is observed for large n, hence plot the output and determine the value of this constant called G so that a Note: G, y(n) for n0o. (b) Determine and plot the transient response given by: n(n) = y(n)- Go (c) Find the energy of the...
(2) Consider the causal discrete-time LTI system with an input r (n) and an output y(n)...
 (2) Consider the causal discrete-time LTI system with an input r (n) and an output y(n) as shown in Figure 1, where K 6 (constant), system #1 is described by its impulse response: h(n) = -36(n) + 0.48(n- 1)+8.26(n-2), and system # 2 has the difference equation given by: y(n)+0.1y(n-1)+0.3y(n-2)- 2a(n). (a) Determine the corresponding difference equation of the system #1. Hence, write its fre- quency response. (b) Find the frequency response of system #2. 1 system #1 system #2...
3.21. Given a filter described by the difference equation y[n] = 2x[n] + 3x[n - 1]...
3.21. Given a filter described by the difference equation y[n] = 2x[n] + 3x[n - 1] + 2x[n - 2] where x[n] is the input signal and y[n] is the output signal. (a) Find and plot h[n] the impulse response of the filter. (b) find and plot H(Ω).
1. For a stable and causal filter described by the following difference equation: yIn] = 1.3y[n-1] + 0.4y[n-2] + 2x[...
 1. For a stable and causal filter described by the following difference equation: yIn] = 1.3y[n-1] + 0.4y[n-2] + 2x[n] - 1.3x[n-1]. For a sinusoidal input elnnu[n], Determine (a) the steady state response, (b) the transient response, (c) the 60 dB time constant.
1. For a stable and causal filter described by the following difference equation: yIn] = 1.3y[n-1] + 0.4y[n-2] + 2x[n] - 1.3x[n-1]. For a sinusoidal input elnnu[n], Determine (a) the steady state response, (b) the transient response,...
1. For a stable and causal filter described by the following difference equation: yIn] = 1.3y[n-1] + 0.4y[n-2] + 2x[n] - 1.3x[n-1]. For a sinusoidal input elnnu[n], Determine (a) the steady state response, (b) the transient response, (c) the 60 dB time constant.
1. For a stable and causal filter described by the following difference equation: yIn] = 1.3y[n-1] + 0.4y[n-2] + 2x[n] - 1.3x[n-1]. For a sinusoidal input elnnu[n], Determine (a) the steady state response, (b) the transient response,...
1. A causal LTI system is implemented by the difference equation y(n) = 2r(n) - 0.5...
 1. A causal LTI system is implemented by the difference equation y(n) = 2r(n) - 0.5 y(n-1). (a) Find the frequency response H/(w) of the system. (b) Plot the pole-zero diagram of the system. Based on the pole zero diagram, roughly sketch the frequency response magnitude |H'(w). (c) Indicate on your sketch of H w , its exact values at w=0, 0.5, and . (d) Find the output signal y(n) produced by the input signal (n) = 3 + cos(0.5...
Please solve using the Discrete-Time Fourier Transform: Given a filter described by the difference equation y[n]...
Please solve using the Discrete-Time Fourier Transform: Given a filter described by the difference equation y[n] = x[n] + 2x[n - 1] + x[n - 3] where x[n] is the input signal and y[n] is the output signal. a) Find H[n] the impulse response of the filter. b) Plot the impulse response c) Find the value of H( Ω) for the following values of Ω = 0, pi, pi/2, and pi/4
If the input to the system described by the difference equation y(n+1) (1/2)x(n+) -x(n) is a)...
 If the input to the system described by the difference equation y(n+1) (1/2)x(n+) -x(n) is a) Does it matter what are the initial conditions for nc0 in order to find y(n) for n20? Explain your b) x(n) -u(n) answer. (3 points). Determine the transfer function H(z) and the Frequency Response (H(est) (10 points). Find the amplitude lH(epT)I and the phase He*') as a function of co. Evaluate both for normalized frequency ω T=z/4. ( 10 points) c) Find the steady...
5 pts D Question 1 A system has the following impulse response: .2 Sample number, n From the choices below, select the frequency response of this system. H (eju)-e(1.5 ) (2 sin( 1.5ώ) +...
 5 pts D Question 1 A system has the following impulse response: .2 Sample number, n From the choices below, select the frequency response of this system. H (eju)-e(1.5 ) (2 sin( 1.5ώ) + 4 sin(0.δώ)) H (ee) = e-j(1.5e-5) (cos( 1.5 ) +2 cos(0.54)) @ H (ee)-e-n1.si) (sin( 1.54) t. 2 sin(0.δώ)) (sin(l.50) +4sin(0.0) H (ee)-e-j(1.5i) (2 cos( 1.5ώ) + 4 cos(0.5a)) H (efo)-e-n1.5u) (cos( 1.50) + 2 cos(0.50)) https://rmitinstructure.comcoursesy 5 pts DQuestion 2 A system has the following...
For the causal filter below y(n) x(n) -20 eja 1-0.8e10 Write the difference equation(show the equation...
 For the causal filter below y(n) x(n) -20 eja 1-0.8e10 Write the difference equation(show the equation clearly and define coefficients) Give and plot the frequency response magnitude (show the equation clearly) Compute and plot the impulse response using MATLAB d a. b. c. Use MATLAB to determine steady state response due to x(n)-u(n) Write a MATLAB program to compute and plot the frequency response of the overall system. Give plots in dB and the program e.
For the causal filter...
For the causal filter below y(n) x(n) -20 eja 1-0.8e10 Write the difference equation(show the equation clearly and define coefficients) Give and plot the frequency response magnitude (show the equation clearly) Compute and plot the impulse response using MATLAB d a. b. c. Use MATLAB to determine steady state response due to x(n)-u(n) Write a MATLAB program to compute and plot the frequency response of the overall system. Give plots in dB and the program e.
For the causal filter...
 matlab please
(4) Consider the system described by the following difference equation y(n)1.77y(n-1)-0.81y(n 2)a(n)- 0.5(n -1) (a) Assuming a unit-step input, and using a long enough section of the input constant output y(n) is observed for large n, hence plot the output and determine the value of this constant called G so that a Note: G, y(n) for n0o. (b) Determine and plot the transient response given by: n(n) = y(n)- Go (c) Find the energy of the...
matlab please
matlab please
(4) Consider the system described by the following difference equation y(n)1.77y(n-1)-0.81y(n 2)a(n)- 0.5(n -1) (a) Assuming a unit-step input, and using a long enough section of the input constant output y(n) is observed for large n, hence plot the output and determine the value of this constant called G so that a Note: G, y(n) for n0o. (b) Determine and plot the transient response given by: n(n) = y(n)- Go (c) Find the energy of the...
 (2) Consider the causal discrete-time LTI system with an input r (n) and an output y(n) as shown in Figure 1, where K 6 (constant), system #1 is described by its impulse response: h(n) = -36(n) + 0.48(n- 1)+8.26(n-2), and system # 2 has the difference equation given by: y(n)+0.1y(n-1)+0.3y(n-2)- 2a(n). (a) Determine the corresponding difference equation of the system #1. Hence, write its fre- quency response. (b) Find the frequency response of system #2. 1 system #1 system #2...
 1. For a stable and causal filter described by the following difference equation: yIn] = 1.3y[n-1] + 0.4y[n-2] + 2x[n] - 1.3x[n-1]. For a sinusoidal input elnnu[n], Determine (a) the steady state response, (b) the transient response, (c) the 60 dB time constant.
1. For a stable and causal filter described by the following difference equation: yIn] = 1.3y[n-1] + 0.4y[n-2] + 2x[n] - 1.3x[n-1]. For a sinusoidal input elnnu[n], Determine (a) the steady state response, (b) the transient response,...
1. For a stable and causal filter described by the following difference equation: yIn] = 1.3y[n-1] + 0.4y[n-2] + 2x[n] - 1.3x[n-1]. For a sinusoidal input elnnu[n], Determine (a) the steady state response, (b) the transient response, (c) the 60 dB time constant.
1. For a stable and causal filter described by the following difference equation: yIn] = 1.3y[n-1] + 0.4y[n-2] + 2x[n] - 1.3x[n-1]. For a sinusoidal input elnnu[n], Determine (a) the steady state response, (b) the transient response,...
 1. A causal LTI system is implemented by the difference equation y(n) = 2r(n) - 0.5 y(n-1). (a) Find the frequency response H/(w) of the system. (b) Plot the pole-zero diagram of the system. Based on the pole zero diagram, roughly sketch the frequency response magnitude |H'(w). (c) Indicate on your sketch of H w , its exact values at w=0, 0.5, and . (d) Find the output signal y(n) produced by the input signal (n) = 3 + cos(0.5...
 If the input to the system described by the difference equation y(n+1) (1/2)x(n+) -x(n) is a) Does it matter what are the initial conditions for nc0 in order to find y(n) for n20? Explain your b) x(n) -u(n) answer. (3 points). Determine the transfer function H(z) and the Frequency Response (H(est) (10 points). Find the amplitude lH(epT)I and the phase He*') as a function of co. Evaluate both for normalized frequency ω T=z/4. ( 10 points) c) Find the steady...
 5 pts D Question 1 A system has the following impulse response: .2 Sample number, n From the choices below, select the frequency response of this system. H (eju)-e(1.5 ) (2 sin( 1.5ώ) + 4 sin(0.δώ)) H (ee) = e-j(1.5e-5) (cos( 1.5 ) +2 cos(0.54)) @ H (ee)-e-n1.si) (sin( 1.54) t. 2 sin(0.δώ)) (sin(l.50) +4sin(0.0) H (ee)-e-j(1.5i) (2 cos( 1.5ώ) + 4 cos(0.5a)) H (efo)-e-n1.5u) (cos( 1.50) + 2 cos(0.50)) https://rmitinstructure.comcoursesy 5 pts DQuestion 2 A system has the following...
 For the causal filter below y(n) x(n) -20 eja 1-0.8e10 Write the difference equation(show the equation clearly and define coefficients) Give and plot the frequency response magnitude (show the equation clearly) Compute and plot the impulse response using MATLAB d a. b. c. Use MATLAB to determine steady state response due to x(n)-u(n) Write a MATLAB program to compute and plot the frequency response of the overall system. Give plots in dB and the program e.
For the causal filter...
For the causal filter below y(n) x(n) -20 eja 1-0.8e10 Write the difference equation(show the equation clearly and define coefficients) Give and plot the frequency response magnitude (show the equation clearly) Compute and plot the impulse response using MATLAB d a. b. c. Use MATLAB to determine steady state response due to x(n)-u(n) Write a MATLAB program to compute and plot the frequency response of the overall system. Give plots in dB and the program e.
For the causal filter...
Most questions answered within 3 hours.
-
Consider the reaction, C3 H8 + O2 --> CO2 + H2O. How many
moles of O2...
asked 47 minutes ago -
You and your opponent both roll a fair die. If you both roll the
same number,...
asked 1 hour ago -
In a study of the accuracy of fast food drive-through orders,
Restaurant A had 257 accurate...
asked 1 hour ago -
Identify and describe in detail the four categories of
institutions that could be included in a...
asked 1 hour ago -
In python
class Customer:
def __init__(self, customer_id, last_name, first_name, phone_number, address):
self._customer_id = int(customer_id)
self._last_name =...
asked 1 hour ago -
What is an example of a limitation in implementing a new
ERP system and how it...
asked 1 hour ago -
In a section of 9.7cm of an artery with a radius of 2.6mm there
is a...
asked 1 hour ago -
the two carboxylic acid groups of aspartic acid have different
acidities with pKa values of 2.1...
asked 1 hour ago -
Would CuCO3 aqueous salt combined with calcium chloride
form a solid precipitate? If so, what would...
asked 1 hour ago -
How do ECM Solutions assist in embedding a culture of continuous
improvement in an organization? (Project...
asked 1 hour ago -
Directions
These directions introduce the idea of Essential Questions.
Since this may be a new concept...
asked 1 hour ago -
1.b. Fiscal policy is said to suffer from ‘crowding out’.
Explain what this means and why...
asked 1 hour ago