Subject ID education memory 1 16 112 2 18 117 3 14 96 4 20 114...
| Subject ID | education | memory |
| 1 | 16 | 112 |
| 2 | 18 | 117 |
| 3 | 14 | 96 |
| 4 | 20 | 114 |
| 5 | 16 | 106 |
| 6 | 14 | 80 |
| 7 | 14 | 89 |
| 8 | 12 | 94 |
| 9 | 18 | 113 |
| 10 | 13 | 111 |
| 11 | 17 | 112 |
| 12 | 18 | 84 |
| 13 | 12 | 108 |
| 14 | 16 | 95 |
| 15 | 12 | 117 |
| 16 | 14 | 83 |
| 17 | 8 | 106 |
| 18 | 12 | 100 |
| 19 | 21 | 120 |
| 20 | 15 | 103 |
The data set for this question set (Tab Q1 in the Excel data file) comes from a research project that tracks the elderly residents in a community to monitor their cognitive function and general health. Based on the literature, education is considered a protective factor against dementia, and memory decline is usually the first sign of dementia. So the researchers would like to know whether education level (measured in number of years of formal schooling) is correlated with memory function (a standardized memory test score) in their sample of elderly residents
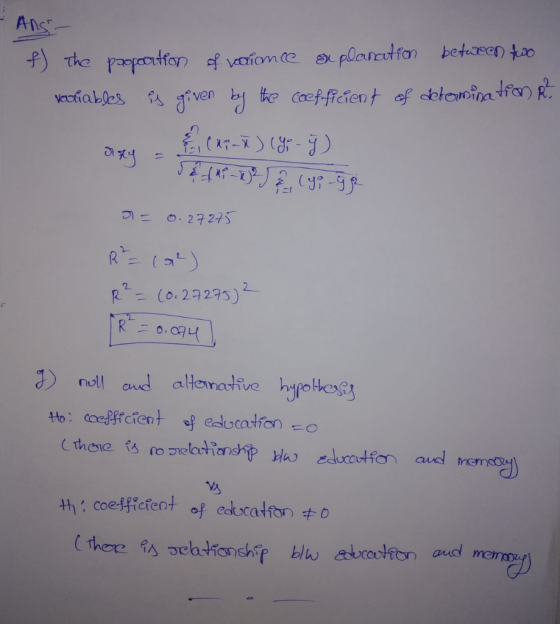
f. What is the proportion of variance shared between the two variables? (That is, how much of the variance in one variable can be predicted by the variance in the other variable?) (2 points total: 1 if the process is correct but the answer is wrong)
g. If the researcher wants to perform a two-tailed hypothesis test using this data set so that she can generalize the relationship between the two variables from the sample to the population, what would be the null and alternative hypothesis? Write the hypotheses in words and in symbol notation. (2 points total: 1 for each hypothesis, .5 for written, .5 for symbol notation)
Homework Answers
Q2) Independent-Samples t-Test (15 points total) In a research project, researchers collected demographic and health data...
Q2) Independent-Samples t-Test (15 points total) In a research project, researchers collected demographic and health data from a sample of elderly residents in the community. To examine any possible gender differences in their sample, they want to see if the females and the males differ significantly on the education level (number of years of formal schooling). The researchers are not predicting any direction in the possible gender differences so the hypotheses should be non-directional. They would like to run a...
Q2) Independent-Samples t-Test (15 points total) Help with H, I, J, K, L please! In a...
Q2) Independent-Samples t-Test (15 points total) Help with H, I, J, K, L please! In a research project, researchers collected demographic and health data from a sample of elderly residents in the community. To examine any possible gender differences in their sample, they want to see if the females and the males differ significantly on the education level (number of years of formal schooling). The researchers are not predicting any direction in the possible gender differences so the hypotheses should...
Problem 3 (20 marks) Determine the mobility of the following planar linkage 16 10 12 4 14 17 15 18 13 Problem 3 (2...
 Problem 3 (20 marks) Determine the mobility of the following planar linkage 16 10 12 4 14 17 15 18 13
Problem 3 (20 marks) Determine the mobility of the following planar linkage 16 10 12 4 14 17 15 18 13
Problem 3 (20 marks) Determine the mobility of the following planar linkage 16 10 12 4 14 17 15 18 13
2. For the following data: 1 2 3 4 5 6 16 20 18 17 18...
 2. For the following data: 1 2 3 4 5 6 16 20 18 17 18 21 a. Calculate the sample mean and sample variance b. Calculate the probability that the population mean is between 9 and 10 if the population standard deviation is known to be 2.3. What is the 95% confidence interval for the population mean if the population standard deviation is known to be 2.3? d. Calculate the 95% confidence interval using the sample standard deviation. c.
For the following data: 1 2 3 4 5 6 16 20 18 17 18 21...
 For the following data: 1 2 3 4 5 6 16 20 18 17 18 21 a. Calculate the sample mean and sample variance b. Calculate the probability that the population mean is between 9 and 10 if the population standard deviation is known to be 2.3. What is the 95% confidence interval for the population mean if the population standard deviation is known to be 2.3? d. Calculate the 95% confidence interval using the sample standard deviation. c.
Please write answers clear. Will leave like if its correct. Age Gen Sibs Work Exercise Units Mom 18 M 1 20 10 15 6 17 F 3 0 7 15 14 23 M 3 20...
 Please write answers clear. Will leave like if its correct.
Age
Gen
Sibs
Work
Exercise
Units
Mom
18
M
1
20
10
15
6
17
F
3
0
7
15
14
23
M
3
20
5
13
8
20
M
2
0
5
15
16
18
F
4
22
6
16
9
20
F
2
11
7
20
20
34
F
1
48
10
10
18
22
F
3
37
13
13
18
19
M
3
0
18
14
18...
Please write answers clear. Will leave like if its correct.
Age
Gen
Sibs
Work
Exercise
Units
Mom
18
M
1
20
10
15
6
17
F
3
0
7
15
14
23
M
3
20
5
13
8
20
M
2
0
5
15
16
18
F
4
22
6
16
9
20
F
2
11
7
20
20
34
F
1
48
10
10
18
22
F
3
37
13
13
18
19
M
3
0
18
14
18...
Please write answers clear. I will leave like if its correct. Age Gen Sibs Work Exercise Units Mom 18 M 1 20 10 15 6 17 F 3 0 7 15 14 23 M 3 2...
 Please write answers clear. I will leave like if its
correct.
Age
Gen
Sibs
Work
Exercise
Units
Mom
18
M
1
20
10
15
6
17
F
3
0
7
15
14
23
M
3
20
5
13
8
20
M
2
0
5
15
16
18
F
4
22
6
16
9
20
F
2
11
7
20
20
34
F
1
48
10
10
18
22
F
3
37
13
13
18
19
M
3
0
18
14...
Please write answers clear. I will leave like if its
correct.
Age
Gen
Sibs
Work
Exercise
Units
Mom
18
M
1
20
10
15
6
17
F
3
0
7
15
14
23
M
3
20
5
13
8
20
M
2
0
5
15
16
18
F
4
22
6
16
9
20
F
2
11
7
20
20
34
F
1
48
10
10
18
22
F
3
37
13
13
18
19
M
3
0
18
14...
2. For the following data: 1 2 3 4 5 5 6 16 20 18 17...
 2. For the following data: 1 2 3 4 5 5 6 16 20 18 17 18 21 1. Calculate the sample mean and sample variance b. Calculate the probability that the population mean is between 9 and 10 if the population standard deviation is known to be 2.3. c. What is the 95% confidence interval for the population mean if the population standard deviation is known to be 2.32 d. Calculate the 95% confidence interval using the sample standard...
tound to 3 decimal places as needed pls This Question: 1 pt 18 of 24 16...
 tound to 3 decimal places as needed pls
This Question: 1 pt 18 of 24 16 completo) This Test: 24 pts possible Use the given data set to complete parts (a) through (c) below. (Us 0.05) x 10 B 13 9 7.47 6.78 12.75 7.11 11 781 14 BR) 6 6.08 & 539 7 12 8.15 574 Click here to view a table of critical values for the correlation coefficient a. Construct a scatterplot. Choose the correct graph below OD...
tound to 3 decimal places as needed pls
This Question: 1 pt 18 of 24 16 completo) This Test: 24 pts possible Use the given data set to complete parts (a) through (c) below. (Us 0.05) x 10 B 13 9 7.47 6.78 12.75 7.11 11 781 14 BR) 6 6.08 & 539 7 12 8.15 574 Click here to view a table of critical values for the correlation coefficient a. Construct a scatterplot. Choose the correct graph below OD...
Please write in the answer clear. Will leave like if its correct . Age Gen Sibs Work Exercise Units Mom 18 M 1 20 10 15 6 17 F 3 0 7 15 14 23 M...
 Please write in the answer clear. Will leave like if its
correct
.
Age
Gen
Sibs
Work
Exercise
Units
Mom
18
M
1
20
10
15
6
17
F
3
0
7
15
14
23
M
3
20
5
13
8
20
M
2
0
5
15
16
18
F
4
22
6
16
9
20
F
2
11
7
20
20
34
F
1
48
10
10
18
22
F
3
37
13
13
18
19
M
3
0...
Please write in the answer clear. Will leave like if its
correct
.
Age
Gen
Sibs
Work
Exercise
Units
Mom
18
M
1
20
10
15
6
17
F
3
0
7
15
14
23
M
3
20
5
13
8
20
M
2
0
5
15
16
18
F
4
22
6
16
9
20
F
2
11
7
20
20
34
F
1
48
10
10
18
22
F
3
37
13
13
18
19
M
3
0...
 Problem 3 (20 marks) Determine the mobility of the following planar linkage 16 10 12 4 14 17 15 18 13
Problem 3 (20 marks) Determine the mobility of the following planar linkage 16 10 12 4 14 17 15 18 13
Problem 3 (20 marks) Determine the mobility of the following planar linkage 16 10 12 4 14 17 15 18 13
 2. For the following data: 1 2 3 4 5 6 16 20 18 17 18 21 a. Calculate the sample mean and sample variance b. Calculate the probability that the population mean is between 9 and 10 if the population standard deviation is known to be 2.3. What is the 95% confidence interval for the population mean if the population standard deviation is known to be 2.3? d. Calculate the 95% confidence interval using the sample standard deviation. c.
 For the following data: 1 2 3 4 5 6 16 20 18 17 18 21 a. Calculate the sample mean and sample variance b. Calculate the probability that the population mean is between 9 and 10 if the population standard deviation is known to be 2.3. What is the 95% confidence interval for the population mean if the population standard deviation is known to be 2.3? d. Calculate the 95% confidence interval using the sample standard deviation. c.
 Please write answers clear. Will leave like if its correct.
Age
Gen
Sibs
Work
Exercise
Units
Mom
18
M
1
20
10
15
6
17
F
3
0
7
15
14
23
M
3
20
5
13
8
20
M
2
0
5
15
16
18
F
4
22
6
16
9
20
F
2
11
7
20
20
34
F
1
48
10
10
18
22
F
3
37
13
13
18
19
M
3
0
18
14
18...
Please write answers clear. Will leave like if its correct.
Age
Gen
Sibs
Work
Exercise
Units
Mom
18
M
1
20
10
15
6
17
F
3
0
7
15
14
23
M
3
20
5
13
8
20
M
2
0
5
15
16
18
F
4
22
6
16
9
20
F
2
11
7
20
20
34
F
1
48
10
10
18
22
F
3
37
13
13
18
19
M
3
0
18
14
18...
 Please write answers clear. I will leave like if its
correct.
Age
Gen
Sibs
Work
Exercise
Units
Mom
18
M
1
20
10
15
6
17
F
3
0
7
15
14
23
M
3
20
5
13
8
20
M
2
0
5
15
16
18
F
4
22
6
16
9
20
F
2
11
7
20
20
34
F
1
48
10
10
18
22
F
3
37
13
13
18
19
M
3
0
18
14...
Please write answers clear. I will leave like if its
correct.
Age
Gen
Sibs
Work
Exercise
Units
Mom
18
M
1
20
10
15
6
17
F
3
0
7
15
14
23
M
3
20
5
13
8
20
M
2
0
5
15
16
18
F
4
22
6
16
9
20
F
2
11
7
20
20
34
F
1
48
10
10
18
22
F
3
37
13
13
18
19
M
3
0
18
14...
 2. For the following data: 1 2 3 4 5 5 6 16 20 18 17 18 21 1. Calculate the sample mean and sample variance b. Calculate the probability that the population mean is between 9 and 10 if the population standard deviation is known to be 2.3. c. What is the 95% confidence interval for the population mean if the population standard deviation is known to be 2.32 d. Calculate the 95% confidence interval using the sample standard...
 tound to 3 decimal places as needed pls
This Question: 1 pt 18 of 24 16 completo) This Test: 24 pts possible Use the given data set to complete parts (a) through (c) below. (Us 0.05) x 10 B 13 9 7.47 6.78 12.75 7.11 11 781 14 BR) 6 6.08 & 539 7 12 8.15 574 Click here to view a table of critical values for the correlation coefficient a. Construct a scatterplot. Choose the correct graph below OD...
tound to 3 decimal places as needed pls
This Question: 1 pt 18 of 24 16 completo) This Test: 24 pts possible Use the given data set to complete parts (a) through (c) below. (Us 0.05) x 10 B 13 9 7.47 6.78 12.75 7.11 11 781 14 BR) 6 6.08 & 539 7 12 8.15 574 Click here to view a table of critical values for the correlation coefficient a. Construct a scatterplot. Choose the correct graph below OD...
 Please write in the answer clear. Will leave like if its
correct
.
Age
Gen
Sibs
Work
Exercise
Units
Mom
18
M
1
20
10
15
6
17
F
3
0
7
15
14
23
M
3
20
5
13
8
20
M
2
0
5
15
16
18
F
4
22
6
16
9
20
F
2
11
7
20
20
34
F
1
48
10
10
18
22
F
3
37
13
13
18
19
M
3
0...
Please write in the answer clear. Will leave like if its
correct
.
Age
Gen
Sibs
Work
Exercise
Units
Mom
18
M
1
20
10
15
6
17
F
3
0
7
15
14
23
M
3
20
5
13
8
20
M
2
0
5
15
16
18
F
4
22
6
16
9
20
F
2
11
7
20
20
34
F
1
48
10
10
18
22
F
3
37
13
13
18
19
M
3
0...
Most questions answered within 3 hours.
-
With a $16 Trillion national ebt, and projected annual budget
eficits in excess of $1 Trillion...
asked 13 minutes ago -
A machine shop owner wishes to assign each of three machinists
(labeled 1, 2, and 3)...
asked 27 minutes ago -
Regarding language development, which of the following
statements is FALSE?
Babies are able to cry from...
asked 27 minutes ago -
A couple of small ice cubes at 0 °C are added to glass of warm
water...
asked 25 minutes ago -
Slow 'n Steady, Inc., has a stock price of $30, will pay a
dividend next year...
asked 29 minutes ago -
During the current financial year, the owner of Omega
Enterprises withdrew supplies of $2,000 for personal...
asked 25 minutes ago -
PLEASE SHOW MATH CALCULATION(formulas)it has to be done on excel
P12-4 Last year (2016), Richter Condos...
asked 33 minutes ago -
A 0.25μF capacitor is charged to 50 V . It is then connected in
series with...
asked 49 minutes ago -
Calculate the current, I, through the batteries for:
- a 2-bulb parallel circuit
- How does...
asked 51 minutes ago -
Choose the sentence that uses correct punctuation.
1a. The prefatory parts of a report include the...
asked 57 minutes ago -
For the element arsenic, which one of the following sets of
quantum numbers could not apply...
asked 1 hour ago -
Compare and contrast the architectures of 3 types of ADCs:
Flash, SAR, and pipelined. Use the...
asked 1 hour ago