Government funding: The following table presents the budget (in millions of dollars) for selected organizations that received U.S. government funding for arts and culture in both 2004 and 2006. Use a TI-84 calculator to answer the following.
Homework Answers
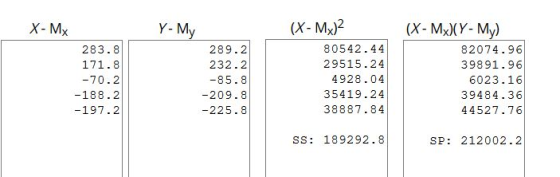
let x represent 2004 values and y represents 2006 values.
Sum of X = 1026
Sum of Y = 1139
Mean X = 205.2
Mean Y = 227.8

Add Answer to:
The following table presents the budget (in millions of dollars) for selected organizations
Government funding: The following table presents the budget (in millions) for selected organizations that received U.S....
Government funding: The following table presents the budget (in millions) for selected organizations that received U.S. government funding for arts and culture in both 2006 and 2016. Organization 2006 2016 Corporation for Public Broadcasting 460 445 Institute of Museum and Library Services 247 237 National Endowment for the Humanities 142 148 National Endowment for the Arts 124 148 National Gallery of Art 95 147 Commission of Fine...
Price of eggs and milk: The following table presents the average price in dollars for a...
 Price of eggs and milk: The following table presents the average price in dollars for a dozen eggs and a gallon of milk for each month from May through December 2012. Use the TI-84 Plus calculator to answer the following. Dozen Eggs 1.83 1.96 Gallon of Milk 3.47 3.58 3.43 3.52 3.58 1.65 1.77 1.89 1.96 1.80 2.01 3.50 3.47 3.40 Send data to Excel Part 2 of 4 (b) Compute the correlation coefficient between the price of eggs and...
The following table of values gives a company's annual profits in millions of dollars. Rescale the...
The following table of values gives a company's annual profits in millions of dollars. Rescale the data so that the year 2001 corresponds to x = 0. Year 2001 2002 2003 2004 2005 2006 Profits (in millions of dollars) 23.8 25.2 26.3 28.9 27.6 28.4 Use the cubic regression model to predict the company's profits in 2010. a) $14.5 million b) $30.3 million c) $32.8 million d) $67.9 million e) $6.8 million f) None of the above
10. Budget balances and the national debt The following table lists federal expenditures, revenues, and GDP...
 10. Budget balances and the national debt The following table lists federal expenditures, revenues, and GDP for a hypothetical economy during several years. Year Expenditures (Billions of dollars) 1,653 GDP (Billions of dollars) 8,747 1998 2000 Revenues (Billions of dollars) 1,722 2,025 1,853 1,880 2,407 1,789 2002 2,011 9,817 10,470 11,686 13,178 2004 2,293 2,655 2006 Plot the data for revenues and expenditures as a percentage of GDP on the following graph, rounded to the nearest percent. Use the purple...
2. Budget balances and the national debt The following table lists federal outlays, revenues, and GDP...
 2. Budget balances and the national debt The following table lists federal outlays, revenues, and GDP for the U.S. economy during several years. Revenues (Billions of dollars) 2,025 Outlays (Billions of dollars) GDP (Billions of dollars) Year 2000 1,789 9,817 2001 1,991 10,128 1,853 10,470 2002 2003 1,863 2,011 2,160 2,293 1,783 10,961 2004 1,880 11,686 Plot the data for revenues and outlays as a percentage of GDP on the following graph, rounded to the nearest percent. Use the purple...
al. Carbon dioxide (CO2) is produced by burning fossil fuels such as oil and natural gas,...
 al. Carbon dioxide (CO2) is produced by burning fossil fuels such as oil and natural gas, and has been connected to global warming. The following table presents the average amounts (in metric tons) of Co, emissions for certain years per person in the United States and per person in the rest of the world. Use a TI-84 calculator to answer the following. Year Non-U.S. U.S. 1990 3.6 19.2 1991 3.6 1992 3.5 1994 3.3 1995 3.3 1997 3.4 1998 3.3...
Men and women have lived in poverty since the beginning of time. Even today millions of...
 Men and women have lived in poverty since the beginning of time. Even today millions of people live below the poverty line. Source:US Census Bureau."Table 7. Poverty in People, by Sex." 1. Use the table below to answer the questions. Year 2000 (t=0) 2000 2001 2002 2003 2004 2005 2006 2007 2008 2009 2010 Men Below Poverty Line (in millions) 136.274 137.558 139.558 140.931 142.433 143.803 145.486 146.655 147.562 149.237 149.737 Women Below Poverty Line (in millions) 142.670 143.917 145:759...
3. E ffects of a government budget deficit Consider a hypothetical open economy. The following table presents data on the relationship between various real interest rates and national saving, domesti...
 3. Effects of a government budget deficit Consider a hypothetical open economy. The following table presents data on the relationship between various real interest rates and national saving, domestic investment, and net capital outflow in this economy, where the currency is the U.S. dollar. Assume that the economy is currently experiencing a balanced government budget. Given the information in the preceding table, use the blue points (circle symbol) to plot the demand for loanable funds. Next, use the orange points (square symbol)...
Reconciling Changes in Balance Sheet Accounts The following table presents selected items from the 2014 and...
Reconciling Changes in Balance Sheet Accounts The following table presents selected items from the 2014 and 2013 balance sheets and 2014 income statement of Walgreen Company. WALGREEN CO. AND SUBSIDIARIES ($ millions) Selected Balance Sheet Data Selected Income Statement Data 2014 2013 2014 Inventories $16,088 $14,756 Cost of Merchandise Sold $103,384 Property and Equipment, Less Depreciation Expense 1,618 Accumulated Depreciation 23,052 22,368 Trade Accounts Payable 9,620 9,170 Net Earnings 5,428 Retained Earnings 37,754 33,696 a. Compute the cash paid for...
1. The federal budget The following table lists federal expenditures, revenues, and GDP for the U.S....
 1. The federal budget The following table lists federal expenditures, revenues, and GDP for the U.S. economy during several years. All numbers are in billions of dollars Year Revenues Expenditures GDP 2000 2001 2002 2003 2004 2,025 1,991 1,853 1,783 1,880 1,789 1,863 2,011 2,160 2,293 9,817 10,128 10,470 10,961 11,686 Plot the data for revenues and expenditures as a percentage of GDP on the following graph, rounded to the nearest percent. Use the purple points (diamond symbol) for expenditures...
 Price of eggs and milk: The following table presents the average price in dollars for a dozen eggs and a gallon of milk for each month from May through December 2012. Use the TI-84 Plus calculator to answer the following. Dozen Eggs 1.83 1.96 Gallon of Milk 3.47 3.58 3.43 3.52 3.58 1.65 1.77 1.89 1.96 1.80 2.01 3.50 3.47 3.40 Send data to Excel Part 2 of 4 (b) Compute the correlation coefficient between the price of eggs and...
 10. Budget balances and the national debt The following table lists federal expenditures, revenues, and GDP for a hypothetical economy during several years. Year Expenditures (Billions of dollars) 1,653 GDP (Billions of dollars) 8,747 1998 2000 Revenues (Billions of dollars) 1,722 2,025 1,853 1,880 2,407 1,789 2002 2,011 9,817 10,470 11,686 13,178 2004 2,293 2,655 2006 Plot the data for revenues and expenditures as a percentage of GDP on the following graph, rounded to the nearest percent. Use the purple...
 2. Budget balances and the national debt The following table lists federal outlays, revenues, and GDP for the U.S. economy during several years. Revenues (Billions of dollars) 2,025 Outlays (Billions of dollars) GDP (Billions of dollars) Year 2000 1,789 9,817 2001 1,991 10,128 1,853 10,470 2002 2003 1,863 2,011 2,160 2,293 1,783 10,961 2004 1,880 11,686 Plot the data for revenues and outlays as a percentage of GDP on the following graph, rounded to the nearest percent. Use the purple...
 al. Carbon dioxide (CO2) is produced by burning fossil fuels such as oil and natural gas, and has been connected to global warming. The following table presents the average amounts (in metric tons) of Co, emissions for certain years per person in the United States and per person in the rest of the world. Use a TI-84 calculator to answer the following. Year Non-U.S. U.S. 1990 3.6 19.2 1991 3.6 1992 3.5 1994 3.3 1995 3.3 1997 3.4 1998 3.3...
 Men and women have lived in poverty since the beginning of time. Even today millions of people live below the poverty line. Source:US Census Bureau."Table 7. Poverty in People, by Sex." 1. Use the table below to answer the questions. Year 2000 (t=0) 2000 2001 2002 2003 2004 2005 2006 2007 2008 2009 2010 Men Below Poverty Line (in millions) 136.274 137.558 139.558 140.931 142.433 143.803 145.486 146.655 147.562 149.237 149.737 Women Below Poverty Line (in millions) 142.670 143.917 145:759...
 1. The federal budget The following table lists federal expenditures, revenues, and GDP for the U.S. economy during several years. All numbers are in billions of dollars Year Revenues Expenditures GDP 2000 2001 2002 2003 2004 2,025 1,991 1,853 1,783 1,880 1,789 1,863 2,011 2,160 2,293 9,817 10,128 10,470 10,961 11,686 Plot the data for revenues and expenditures as a percentage of GDP on the following graph, rounded to the nearest percent. Use the purple points (diamond symbol) for expenditures...
Most questions answered within 3 hours.
-
Assume that the population of Mexico is 128
million and that the population increases 1.01
percentannually....
asked 10 minutes ago -
Can someone please help me add appropriate descriptive
comments to each line of code in the...
asked 16 minutes ago -
Romeo wishes to throw a bouquet of flowers to Juliet, who is on
a second-story balcony,...
asked 1 hour ago -
Why is QE a controversial monetary policy tool.
A. It may lead to excessive inflation.B. By...
asked 1 hour ago -
Principles of Programming midterm study guide help!
1.)
______ Which of the following would reference the...
asked 1 hour ago -
A finite potential well has depth U0 = 2.78 eV . What is the
penetration distance...
asked 1 hour ago -
1. The bus bars of a power station are in two sections A and B
separated...
asked 1 hour ago -
Fiscal policy is the deliberate manipulation of taxes and
government spending to alter GDP, employment, inflation...
asked 2 hours ago -
evaluating an expression using only one digit and + and - as
operators ....3+5-1+7-5+8
-----------------------
stack...
asked 2 hours ago -
Two concentric current loops lie in the same plane. The smaller
loop has a radius of...
asked 3 hours ago -
1)Which of the following is an
important difference between qualified and nonqualified retirement
plans?
a. Qualified...
asked 3 hours ago -
What's the streaming business's problem on the
horizon?
asked 4 hours ago