Suppose that a simple random sample of 145, 91 said they drink coffee in the morning....
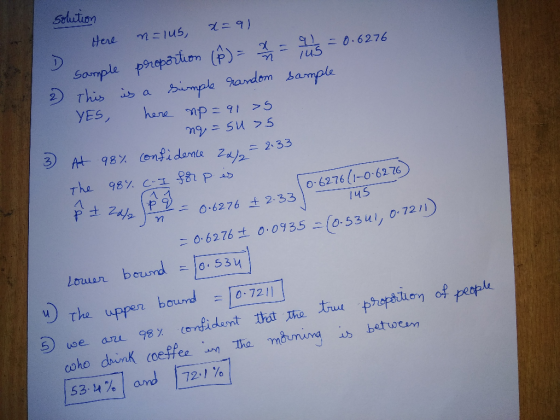
Suppose that a simple random sample of 145, 91 said they drink coffee in the morning.
Step 1 of 5:
What is the sample proportion for people who drink coffee in the morning?
Step 2 of 5:
Do we have what we need to compute a confidence interval?
Yes, it's binomial. Yes, n≥30.
Yes, we have a simple random sample, it is binomial with n/.05 gives a value less than the number of people than that in the world, and n*p-hat and n*(1-p-hat) are both greater than 5.
No, we do not have a normal population.
No, it's not binomial.
Step 3 of 5:
Find the lower bound for a 98% confidence interval of the true proportion of people who drink coffee in the morning, accurate to 3 decimal places.
Step 4 of 5:
Find the upper bound for a 98% confidence interval of the true proportion of people who drink coffee in the morning, accurate to 3 decimal places.
Step 5 of 5:
Choose the correct interpretation of this confidence interval.
We are 98% confident that the true proportion of people who drink coffee in the morning is between [lower bound as a percentage] and [upper bound as a percentage].
We are 98% confident that between [lower bound] and [upper bound] people drink coffee in the morning.
We are between [lower bound as a percentage] and [upper bound as a percentage] sure that 98% of people drink coffee in the morning.
I used my calculator and did 1-Prop Z-Int.
Homework Answers
Add Answer to:
Suppose that a simple random sample of 145, 91 said they drink
coffee in the morning....
Suppose that a simple random sample of 121 people finds that 40 eat chocolate every day....
Suppose that a simple random sample of 121 people finds that 40 eat chocolate every day. Use this information to answer the following. A)What is the sample proportion for people who each chocolate every day? B)Do we have what we need to compute a confidence interval? Be sure to include your reasoning for full credit. C)Find the lower bound for a 98% confidence interval of the true proportion of people who eat chocolate daily, accurate to 3 decimal places. D)Find...
A random sample of 320 medical doctors showed that 180 had a solo practice. (a) Let...
 A random sample of 320 medical doctors showed that 180 had a solo practice. (a) Let p represent the proportion of all medical doctors who have a solo practice. Find a point estimate for p. (Use 3 decimal places.) (b) Find a 98% confidence interval for p. (Use 3 decimal places.) lower limit upper limit Give a brief explanation of the meaning of the interval. 98% of the all confidence intervals would include the true proportion of physicians with solo...
2.) I want to estimate the proportion of people who drink coffee in the morning. How...
 2.) I want to estimate the proportion of people who drink coffee in the morning. How many people should I poll to be 97% confident that I am within 1.5% of the actual proportion? 3.) Repeat #2, but assume that last year the polls showed that 40% drink coffee.
the sample data and confidence level given below to complete parts (a) through (d). A research...
the sample data and confidence level given below to complete parts (a) through (d). A research institute poll asked respondents if they felt vulnerable to identity theft. In the poll, n=952 and x= 512 who said "yes." Use a 99% confidence level. a.) Find the best point estimate of the population proportion p. b.) Identify the value of the margin of error E. c.) Construct the confidence interval. d.) Write a statement that correctly interprets the confidence interval. Choose the...
Use the sample data and confidence level given below to complete parts (a) through (d). A...
Use the sample data and confidence level given below to complete parts (a) through (d). A research institute poll asked respondents if they felt vulnerable to identity theft. In the poll, n equals 1036 and x equals 567 who said "yes." Use a 90 % confidence level. A) Find the best point estimate of the population proportion p. b) Identify the value of the margin of error E. c) Construct the confidence interval. d) Write a statement that correctly interprets...
A simple random sample of size n is drawn from a population that is normally distributed....
A simple random sample of size n is drawn from a population that is normally distributed. The sample mean, x overbar x, is found to be 107, and the sample standard deviation, s, is found to be 10. (a) Construct a 98% confidence interval about mu μ if the sample size, n, is 18. (b) Construct a 98% confidence interval about mu μnif the sample size, n, is 12. c) Construct a 96% confidence interval about mu μ if...
In 1996, the General Social Survey (which uses a method similar to simple random sampling) asked,...
In 1996, the General Social Survey (which uses a method similar to simple random sampling) asked, "On the whole, do you think it should be the government's responsibility to provide decent housing for those who can't afford it?" For this question, 240 people said that it definitely should out of 1572 randomly selected people. We will make a 90% confidence interval for: p, the true population proportion that would have answered yes to this question p-hat, the sample proportion that...
Use the sample data and confidence level given below to complete parts (a) through (d). A...
 Use the sample data and confidence level given below to complete parts (a) through (d). A research Institute poll asked respondents if they felt vulnerable to identity theft. In the poll, n 990 and x 599 who said "yes." Use a 90% confidence level. Click the icon to view a table of z scores a) Find the best point estimate of the population proportion p. (Round to three decimal places as needed.) b) Identify the value of the margin of...
Use the sample data and confidence level given below to complete parts (a) through (d). A...
 Use the sample data and confidence level given below to complete parts (a) through (d). A research Institute pollasked respondents if they felt vulnerable to identity theft. In the poll, n=948 and x = 532 who said "yes"Use a 99% confidence level. Click the icon to view a table of z scores. a) Find the best point estimate of the population proportion p. (Round to three decimal places as needed.) b) Identify the value of the margin of error E....
Use the sample data and confidence level given below to complete parts (a) through (d). A...
Use the sample data and confidence level given below to complete parts (a) through (d). A research institute poll asked respondents if they felt vulnerable to identity theft. In the poll, n=1036 and x=526 who said "yes." Use a 99 % confidence level. Click the icon to view a table of z scores. a) Find the best point estimate of the population proportion p. _____ (Round to three decimal places as needed.) b) Identify the value of the margin of...
 A random sample of 320 medical doctors showed that 180 had a solo practice. (a) Let p represent the proportion of all medical doctors who have a solo practice. Find a point estimate for p. (Use 3 decimal places.) (b) Find a 98% confidence interval for p. (Use 3 decimal places.) lower limit upper limit Give a brief explanation of the meaning of the interval. 98% of the all confidence intervals would include the true proportion of physicians with solo...
 2.) I want to estimate the proportion of people who drink coffee in the morning. How many people should I poll to be 97% confident that I am within 1.5% of the actual proportion? 3.) Repeat #2, but assume that last year the polls showed that 40% drink coffee.
 Use the sample data and confidence level given below to complete parts (a) through (d). A research Institute poll asked respondents if they felt vulnerable to identity theft. In the poll, n 990 and x 599 who said "yes." Use a 90% confidence level. Click the icon to view a table of z scores a) Find the best point estimate of the population proportion p. (Round to three decimal places as needed.) b) Identify the value of the margin of...
 Use the sample data and confidence level given below to complete parts (a) through (d). A research Institute pollasked respondents if they felt vulnerable to identity theft. In the poll, n=948 and x = 532 who said "yes"Use a 99% confidence level. Click the icon to view a table of z scores. a) Find the best point estimate of the population proportion p. (Round to three decimal places as needed.) b) Identify the value of the margin of error E....
Most questions answered within 3 hours.
-
Twitter Users and News: A poll conducted in 2013 found that 52%
of U.S. adult Twitter...
asked 9 minutes ago -
How
would I know whether a given amino acid has an ionizable group or
not? please...
asked 17 minutes ago -
True or false?
True False The function of the enzyme acyl CoA
synthetase is the ATP-dependent coupling...
asked 17 minutes ago -
Nadia Corporation adjusts its debt so that its interest coverage
(EBIT/Interest) remains constant at 3. Nadia’s...
asked 19 minutes ago -
In a clinical trial, 20 out of 600 patients taking a
prescription drug complained of flulike...
asked 25 minutes ago -
7. How many types of nuclear processes can produce energy? 8.
How many types of radioactive...
asked 29 minutes ago -
For both the Sn2 and Sn1 reaction
conditions:
Structure | Rxn (Y/N) at room T° Rxn...
asked 29 minutes ago -
11. In cell N2, enter a formula using the IF function and a
structured reference to...
asked 29 minutes ago -
There is X-linked mutations in flies in this example. You need
to determine the inheritence pattern...
asked 31 minutes ago -
1) There is a 5.0 μC charge at each of 3 corners of a square
(each...
asked 42 minutes ago -
A study of 420,095 cell phone users found that
134 of them developed cancer of the...
asked 46 minutes ago -
2.50 g of NH4Cl is added to 12.9 g of water. Calculate the
molality of the...
asked 48 minutes ago