

Homework Answers
Plotting a titration curve withe the values of pH and volume of the base:
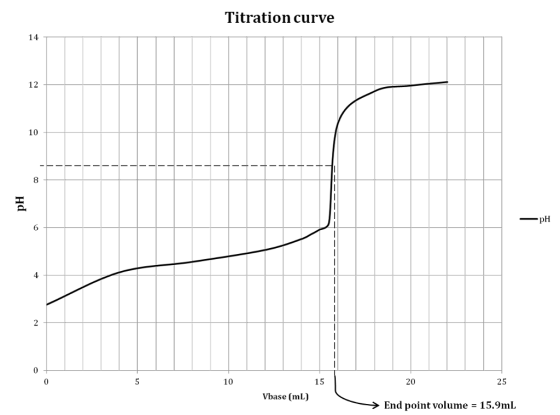
The electronic end point occurs exactly when 15.9 mL of base has been added.
1. The exact concentration of the base by using phenolphtalein, can be calculated using:

Solving for MB:

Where MA is 0.100 M, VA is 25 mL and VB is 16.01 mL, the exact concentration of base is:

2. The exact concentration of the base by electronic end point, can be calculated using:
Solving for MB:
Where MA is 0.100 M, VA is 25 mL and VB is 15.9 mL, the exact concentration of base is:

3. The percent difference between these values, using (2) as the standard is calculated using:
% %
%
This shows us that the use of indicators in acid-base titrations may cause a little error due to its character as an acid-base substance, and the pH useful range of it.
4. The useful range for phenolphtalein is 8.3-10 pH units. It is right in the region when electronic end point is reached, so we can think that the error in titration is low, as we calculate in 3.
It was the expected because in the plot of titration curve, the pH changes near to the end point are between 6 an 12 pH units, and the indicator has an useful range of 8.3-10. Also, end point in the titration curve is closely near to 8.3 pH units.
Add Answer to:
Experiment 13 Acid-Base Equilibria, Part I1 Lab partner Report Sheet Data Titration 1: Solution being titrated...
Pre-lab Questions for Experiment #8 (Experiment-20 in our lab manual) Titration of Acids and Bases 1)...
 Pre-lab Questions for Experiment #8 (Experiment-20 in our lab manual) Titration of Acids and Bases 1) Fill in the blanks in the following figure that represents the setup of today's experiment N Y (6) (1)------- - (2) ---------- (3)---------- -------------- (4)---------- 17 (8) _----- --------------- (5) --------- TO --------------- 2) What is the purpose of using phenolphthalein for an acid-base titration? 3) What is the color of phenolphthalein indicator in: a) Acidic solution: _;b) Basic solution: 4) A 40.0 mL...
Of Hydrofluoric acid (Ka-6.6 x 10") solution is titrated with f NaOH. Draw a titration curve, lab...
 of Hydrofluoric acid (Ka-6.6 x 10") solution is titrated with f NaOH. Draw a titration curve, labeling the initial pH (when no sodium 40. 100 ml ofa 0.3 M olution 0.3 M solution hydroxide has been added), the pH at the mid-point of the titration, and the pH at the equivalence point (16 points).
of Hydrofluoric acid (Ka-6.6 x 10") solution is titrated with f NaOH. Draw a titration curve, labeling the initial pH (when no sodium 40. 100 ml...
of Hydrofluoric acid (Ka-6.6 x 10") solution is titrated with f NaOH. Draw a titration curve, labeling the initial pH (when no sodium 40. 100 ml ofa 0.3 M olution 0.3 M solution hydroxide has been added), the pH at the mid-point of the titration, and the pH at the equivalence point (16 points).
of Hydrofluoric acid (Ka-6.6 x 10") solution is titrated with f NaOH. Draw a titration curve, labeling the initial pH (when no sodium 40. 100 ml...
Sketch a pH vs. Volume added graph (titration curve) for a diprotic acid being titrated with...
Sketch a pH vs. Volume added graph (titration curve) for a diprotic acid being titrated with NaOH. Label the axis and equivalence points.
It's a weak acid strong base titration Experiment 4: Identification of an unknown acid by titration...
 It's a weak acid strong base titration
Experiment 4: Identification of an unknown acid by titration Page 2 of 15 Background In this experiment, you will use both qualitative and quantitative properties to determine an unknown acid's identity and concentration. To do this analysis, you will perform a titration of your unknown acid sample-specifically a potentiometric titration where you use a pH meter and record pH values during the titration, combined with a visual titration using a color indi- cator...
It's a weak acid strong base titration
Experiment 4: Identification of an unknown acid by titration Page 2 of 15 Background In this experiment, you will use both qualitative and quantitative properties to determine an unknown acid's identity and concentration. To do this analysis, you will perform a titration of your unknown acid sample-specifically a potentiometric titration where you use a pH meter and record pH values during the titration, combined with a visual titration using a color indi- cator...
Titration of Weak Acid with Strong Base A certain weak acid, HA, with a Ka Value of 5.61 *10^-6, is titrated wit...
Titration of Weak Acid with Strong Base A certain weak acid, HA, with a Ka Value of 5.61 *10^-6, is titrated with NaOH. PART A A solution is made by mixing 8.00 mmol(millimoles) of HA and 1.00 mmol of the strong base. What is the resulting pH? express the pH numerically to two decimal places. pH = ? PART B More strong base is added until the equicalence point is reached. What is the pH of this solution at the...
1. What is the definition of an 'equivalence point' in an acid/base titration? (1 point) 2....
 1. What is the definition of an 'equivalence point' in an acid/base titration? (1 point) 2. In part one of the experiment, you will prepare the acid solutions being titrated from a stock solution. Describe how you will accurately prepare 10.00 mL of 0.100 M HCl solution using a 1.00 M HCl stock solution. In your response to this question, be very specific about the quantities of stock solution and deionized water to be used in the dilution and the...
Titration of a Weak Base Prelaboratory Questions 1. Will addition of HCl to a solution make...
 Titration of a Weak Base Prelaboratory Questions 1. Will addition of HCl to a solution make it more acidic or more basic? Will the pH increase or decrease? How does an end point differ from an equivalence point? 2. were titrated with a standard HCl solution: 3. Aliquots of an unknown tris sample Use the balanced equation to set up the string calculation showing how the tris a. mol of acid, L of acid. mo of base, and L of...
1. Titration Curve - Titration of a weak acid with a strong base 13 12 115...
 1. Titration Curve - Titration of a weak acid with a strong base 13 12 115 104 9 рН 1 6 2 10 30 90 110 50 70 mL of NaOH A. The "circle” on the graph represents the B. The pH at the point in part A is C. What volume of base was used to titrate the acid solution? (This volume of base is where the moles of acid = moles of base.) D. The "triangle" on this...
Data the experiment Record For the lab report, attach this data sheet (signed by your TA) to your...
 please write out calculations for each box missing an answer
data the experiment Record For the lab report, attach this data sheet (signed by your TA) to your calculations page. REPORT ALL VALUES TO AT LEAST THREE SIGNIFICANT FIGURES. READ YOUR BURETTE TO THE NEAREST 0.05 mL increment. for on this sheet. Do your calculations on a separate piece of paper. Part One-Standardization of a NaOH solution of approximately 0.1 M. Trial 1 | Trial 2 | Trial 3 Mass...
please write out calculations for each box missing an answer
data the experiment Record For the lab report, attach this data sheet (signed by your TA) to your calculations page. REPORT ALL VALUES TO AT LEAST THREE SIGNIFICANT FIGURES. READ YOUR BURETTE TO THE NEAREST 0.05 mL increment. for on this sheet. Do your calculations on a separate piece of paper. Part One-Standardization of a NaOH solution of approximately 0.1 M. Trial 1 | Trial 2 | Trial 3 Mass...
Part A: Calculating a Theoretical Titration Curve (Weak Acid - Strong Base) Consider the titration of...
 Part A: Calculating a Theoretical Titration Curve (Weak Acid - Strong Base) Consider the titration of 50.00 mL of 0.05 M acetic acid with 0.1 M NaOH. Calculate the pH of the resulting solution at the following points during the titration (given as volume of NaOH added). Volume NaOH pH of analyte 0.00 15.00 20.00 24.00 24.50 mL at equivalence point 40.00
 Pre-lab Questions for Experiment #8 (Experiment-20 in our lab manual) Titration of Acids and Bases 1) Fill in the blanks in the following figure that represents the setup of today's experiment N Y (6) (1)------- - (2) ---------- (3)---------- -------------- (4)---------- 17 (8) _----- --------------- (5) --------- TO --------------- 2) What is the purpose of using phenolphthalein for an acid-base titration? 3) What is the color of phenolphthalein indicator in: a) Acidic solution: _;b) Basic solution: 4) A 40.0 mL...
 of Hydrofluoric acid (Ka-6.6 x 10") solution is titrated with f NaOH. Draw a titration curve, labeling the initial pH (when no sodium 40. 100 ml ofa 0.3 M olution 0.3 M solution hydroxide has been added), the pH at the mid-point of the titration, and the pH at the equivalence point (16 points).
of Hydrofluoric acid (Ka-6.6 x 10") solution is titrated with f NaOH. Draw a titration curve, labeling the initial pH (when no sodium 40. 100 ml...
of Hydrofluoric acid (Ka-6.6 x 10") solution is titrated with f NaOH. Draw a titration curve, labeling the initial pH (when no sodium 40. 100 ml ofa 0.3 M olution 0.3 M solution hydroxide has been added), the pH at the mid-point of the titration, and the pH at the equivalence point (16 points).
of Hydrofluoric acid (Ka-6.6 x 10") solution is titrated with f NaOH. Draw a titration curve, labeling the initial pH (when no sodium 40. 100 ml...
 It's a weak acid strong base titration
Experiment 4: Identification of an unknown acid by titration Page 2 of 15 Background In this experiment, you will use both qualitative and quantitative properties to determine an unknown acid's identity and concentration. To do this analysis, you will perform a titration of your unknown acid sample-specifically a potentiometric titration where you use a pH meter and record pH values during the titration, combined with a visual titration using a color indi- cator...
It's a weak acid strong base titration
Experiment 4: Identification of an unknown acid by titration Page 2 of 15 Background In this experiment, you will use both qualitative and quantitative properties to determine an unknown acid's identity and concentration. To do this analysis, you will perform a titration of your unknown acid sample-specifically a potentiometric titration where you use a pH meter and record pH values during the titration, combined with a visual titration using a color indi- cator...
 1. What is the definition of an 'equivalence point' in an acid/base titration? (1 point) 2. In part one of the experiment, you will prepare the acid solutions being titrated from a stock solution. Describe how you will accurately prepare 10.00 mL of 0.100 M HCl solution using a 1.00 M HCl stock solution. In your response to this question, be very specific about the quantities of stock solution and deionized water to be used in the dilution and the...
 Titration of a Weak Base Prelaboratory Questions 1. Will addition of HCl to a solution make it more acidic or more basic? Will the pH increase or decrease? How does an end point differ from an equivalence point? 2. were titrated with a standard HCl solution: 3. Aliquots of an unknown tris sample Use the balanced equation to set up the string calculation showing how the tris a. mol of acid, L of acid. mo of base, and L of...
 1. Titration Curve - Titration of a weak acid with a strong base 13 12 115 104 9 рН 1 6 2 10 30 90 110 50 70 mL of NaOH A. The "circle” on the graph represents the B. The pH at the point in part A is C. What volume of base was used to titrate the acid solution? (This volume of base is where the moles of acid = moles of base.) D. The "triangle" on this...
 please write out calculations for each box missing an answer
data the experiment Record For the lab report, attach this data sheet (signed by your TA) to your calculations page. REPORT ALL VALUES TO AT LEAST THREE SIGNIFICANT FIGURES. READ YOUR BURETTE TO THE NEAREST 0.05 mL increment. for on this sheet. Do your calculations on a separate piece of paper. Part One-Standardization of a NaOH solution of approximately 0.1 M. Trial 1 | Trial 2 | Trial 3 Mass...
please write out calculations for each box missing an answer
data the experiment Record For the lab report, attach this data sheet (signed by your TA) to your calculations page. REPORT ALL VALUES TO AT LEAST THREE SIGNIFICANT FIGURES. READ YOUR BURETTE TO THE NEAREST 0.05 mL increment. for on this sheet. Do your calculations on a separate piece of paper. Part One-Standardization of a NaOH solution of approximately 0.1 M. Trial 1 | Trial 2 | Trial 3 Mass...
 Part A: Calculating a Theoretical Titration Curve (Weak Acid - Strong Base) Consider the titration of 50.00 mL of 0.05 M acetic acid with 0.1 M NaOH. Calculate the pH of the resulting solution at the following points during the titration (given as volume of NaOH added). Volume NaOH pH of analyte 0.00 15.00 20.00 24.00 24.50 mL at equivalence point 40.00
Most questions answered within 3 hours.
-
1. If a corporation purchases land and building and subsequently
tears down the building and uses...
asked 5 minutes ago -
Consider a 23-year bond with 7 percent annual coupon payments.
The market rate (YTM) is 6.4...
asked 8 minutes ago -
a tuba creates a 4th harmonic of frequency 116.5 Hz. what is the
frequency of the...
asked 14 minutes ago -
A coconut mass 2kg falls from a 30m tall tree. The coconut falls
and comes to...
asked 17 minutes ago -
Group Policies
Research GROUP POLICY OBJECTS (GPO'S)
You can start in the Windows Server 2012 eBook...
asked 21 minutes ago -
software engineering
Problems.
Create a use case diagram for class registration for a
university.
Create a...
asked 21 minutes ago -
You are trying to convince your friend who wants to attend
medical school to take BY123...
asked 36 minutes ago -
Subject: C++
I have created a class called QueueOfIntegers in a file called
QueueOfIntegers.h, which is...
asked 36 minutes ago -
calculate the number of molecules of gas in a
container of 2.0 liter at 30 degrees...
asked 53 minutes ago -
1.which of the following is a phototroph?
a. sulfolobus
b. chloroflexus
c. bacteroidetes
d. deinococcus radioduran...
asked 49 minutes ago -
The group of companies LC "High-precision measuring instruments"
is the global provider of measurement, analysis and...
asked 55 minutes ago -
I want to write a python function to find the minimum
I have an nested list:...
asked 55 minutes ago