Hi! Can someone explain WHY #2 is what it is? I don't understand where those numbers came from. In addition, can you explain where the numbers came from on the bands on the gel in #4? Thanks!

Homework Answers
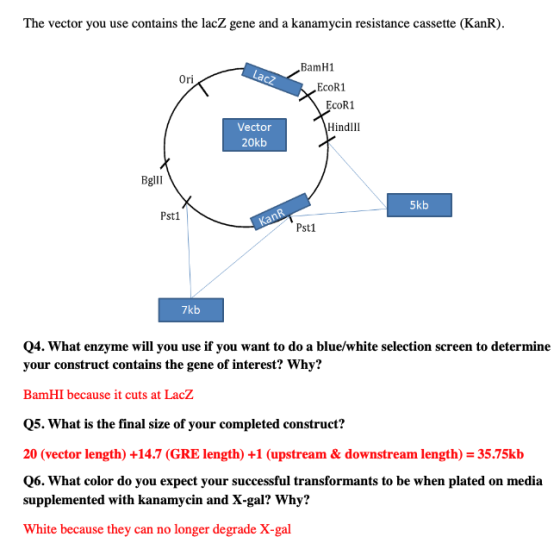
Answer4 . As shown in the vector diagram the BamHI site is in between the lacZ gene that translates for beta galactosidase and in turn help in blue white screening.
Answer 5. The final size include the inserted DNA (14.7Kb) and its constituent like upstream and downstream (1Kb) and vector itself because we are inserting the insert DNA into vector.
So total come 35.75 Kb.
Answer cutting with HindIII there is single band which means that there is only single restriction site in vector.
In case of PstI there are two bands which means that the vector contains two PstI restriction site. As given in diagram size between two PstI site is 7Kb then remain 13Kb will be the size of other bands
Also when we inserted our insert then there are 3 bands sizes are 23kb + 7kb + 5 kb = 35kb which is nearby to our inserted DNA site
Add Answer to:
Hi! Can someone explain WHY #2 is what it is? I don't understand
where those numbers...
Hi can someone help me understand part C and why the drawn in red lines are...
 Hi can someone help me understand part C and why the
drawn in red lines are where they are.
Basically from the bp given how can I go back to cm so I can
drawn them into the picture provided?
Do not need help with A or B.
The following question will provide practice in interpreting and analyzing gel results You obtained the DNA electrophoresis gel below. Three samples of lambda phage DNA were digested with 3 different restriction enzymes...
Hi can someone help me understand part C and why the
drawn in red lines are where they are.
Basically from the bp given how can I go back to cm so I can
drawn them into the picture provided?
Do not need help with A or B.
The following question will provide practice in interpreting and analyzing gel results You obtained the DNA electrophoresis gel below. Three samples of lambda phage DNA were digested with 3 different restriction enzymes...
Most questions answered within 3 hours.
-
. A marketing researcher conducted a survey of 25 shoppers
randomly selected at the local mall...
asked 12 minutes ago -
Create an comprehensive response to the
following:
Antimicrobial agents work on a multitude of microbes (bacteria,...
asked 13 minutes ago -
6.13 LAB: Step counter. Section 6.3.
A pedometer treats walking 2,000 steps as walking 1 mile....
asked 9 minutes ago -
(14.2) A block of mass m = 10 kg riding on a frictionless
horizontal plane is...
asked 12 minutes ago -
Use any search engine to search for articles about Starbucks
partnership with Tata Companies in India...
asked 10 minutes ago -
Let’s say that for some reason Bank Excess Reserves suddenly
increase sharply. What effect would this...
asked 20 minutes ago -
Given:
Curent Assets: $600,000
Total Assets: $2,600,000
Current Liabilities: $500,000
Total Liabilities: $1,700,000
What is the...
asked 25 minutes ago -
1. What is a “Bankster”? What is insider trading? Why is it
illegal?
2. What is...
asked 23 minutes ago -
A transverse wave on a cord is given by
D(x,t)=0.18sin(2.7x−61.0t), where Dand x are in m...
asked 29 minutes ago -
ASSIGNMENT
ANSWER ANY TWO OF THE FOLLOWING IN 2-3 PARAGRAPHS OF EACH
QUESTION.
1: Where is...
asked 28 minutes ago -
Question 1 (5 marks)
Studies have shown that the price elasticity for GP
consultations is -0.2...
asked 30 minutes ago -
The owner of 22 restaurants was asked how he does marketing
research. He answered that he...
asked 34 minutes ago