For each of the major absorption peaks that you have identified in the IR spectra of...
For each of the major absorption peaks that you have identified in the IR spectra of methyl benzoate and your triphenylmethanol derivative, list the frequencies and functional group to which it corresponds to.
Homework Answers
| 3100-3000 cm−1(w) | Aromatic C-H stretch |
| 2960 and 2870 cm−1(m) | Methyl C-H stretch |
| 1730-1715 cm−1(s) | Conjugated ester C=O stretch |
| 1600-1585 cm−1(m) and 1500-1400 cm−1(m) | Aromatic C-C stretch |
| 1380 cm−1(w) and 1260 cm−1(m) | C-O stretch |
| 750-700 cm−1(s) and 710-690 cm−1(m) | Aromatic C-H 'out-of-plane' bend |
The structure of methyl benzoate is
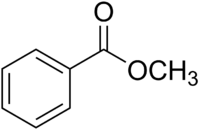
It has a monosubstituted benzene ring, an ester group, and a
methyl group.
1. C-O stretching
The strongest peak should be the ester C=O stretch.
This normally appears at 1750-1735 cm−1, but conjugation with the ring shifts the peak to 1730-1715 cm−1.
There should also be one medium and two strong bands in the region from 1300-1000 cm−1.
The two strong bands arise from the symmetric and antisymmetric
C-O stretches of the ester COO group, and the weaker band is the
ether CO stretch of the OCH3 group.
Triphenylmethanol IR major peaks:
An alcohol (-OH) peak should be around 3550-3200 cm-1. It must be a
broad. Its a major peak
also you can see C-O peak around 1300-1000 cm-1
Add Answer to:
For each of the major absorption peaks that you have
identified in the IR spectra of...
1. shown below are IR spectra of cyclohexanecarbaldehyde (I) and cyclohexene (II). which of the spectra...
 1. shown below are IR spectra of cyclohexanecarbaldehyde (I)
and cyclohexene (II). which of the spectra A and B corresponds to
which structure (I or II)? On each spectrum identify the peaks that
are associated with a specific bond vibration bond by drawing the
functional group for that bond, circling the specific vibrating
bond and drying and arrow from the circled bond to the absorption
peak. include all the C-H bonds.
2. provided below are IR spectra of
1,2,3,6-tetrahydrobenzaldehyde (I)...
1. shown below are IR spectra of cyclohexanecarbaldehyde (I)
and cyclohexene (II). which of the spectra A and B corresponds to
which structure (I or II)? On each spectrum identify the peaks that
are associated with a specific bond vibration bond by drawing the
functional group for that bond, circling the specific vibrating
bond and drying and arrow from the circled bond to the absorption
peak. include all the C-H bonds.
2. provided below are IR spectra of
1,2,3,6-tetrahydrobenzaldehyde (I)...
Record the IR spectra of the following: carvone, menthone, limonene, cintronellol,citral, and p-cymene. Share data with...
 Record the IR spectra of the following: carvone, menthone, limonene, cintronellol,citral, and p-cymene. Share data with the other students regarding the other spectra Fill in the chart below with the major peaks found in ench IR spectrum. Assign the major peaks to the functional group present in each compound UUUUUUUUUUUUUU Compound Major IR frequencies Assignments
IR spectrum and absorption peaks of propyl p-tolyl ether
 For the IR or Infrared spectrum and labeled absorption peaks of propyl p-tolyl ether. What bond or functional group does each major peak represent?
For each of the following organic compounds, list all of the IR absorption peaks that would be ob...
 A-C please
For each of the following organic compounds, list all of the IR absorption peaks that would be observed based on the bonds and functional groups that are present. Make sure to indicate whether each peak corresponds to a stretch or an out of plane bend. Note: For this question, there is no need to include the wavenumber range for each vibrational mode. [14 points] 1. CN Нас NO2 b. CH OCH3 C. он
For each of the following...
A-C please
For each of the following organic compounds, list all of the IR absorption peaks that would be observed based on the bonds and functional groups that are present. Make sure to indicate whether each peak corresponds to a stretch or an out of plane bend. Note: For this question, there is no need to include the wavenumber range for each vibrational mode. [14 points] 1. CN Нас NO2 b. CH OCH3 C. он
For each of the following...
2. (2 pts.) Provided below are IR spectra of 1,2,3,6-tetrahydrobenzaldehyde (I) and 3-methyl-2-cyclohexen-1-one (II). Decide which...
 2. (2 pts.) Provided below are IR spectra of 1,2,3,6-tetrahydrobenzaldehyde (I) and 3-methyl-2-cyclohexen-1-one (II). Decide which of the IR spectra A and B corresponds to which structure (I or II). On each spectrum, identify the peaks that are associated with a specific bond vibration bond by drawing the functional group for that bond, circling the specific vibrating bond and drawing an arrow from the circled bond to the absorption peak, as appropriate. Include all the C-H bonds. odo and II...
Identify all major functional groups in the IR spectra Identify all peaks in 1H- and isC-NMR...
 Identify all major functional groups in the IR spectra Identify all peaks in 1H- and isC-NMR spectra. Identify the molecular mass of the unknown from the mass spectrum Determine the pattern of fragmentation from the mass spectrum Generate a molecular formula Determine the Index of Hydrogen Deficiency Determine the structure of the unknown compound.
Please help to identifying all major peaks in the functional group region with this IR spectra....
 Please help to identifying all major peaks in the functional group
region with this IR spectra.
This IR is the synthesis of DEET.
74 1942 2321.37cm-1 882.92m 3678 3472 69cm- 2ホ430m-1 1743.05qm- 3 82㎝1 820T-1 944 cm 887,1 45- 914.060 25 086cm-1 4 07cm-1 - 221 3049.89cm-1 2872 98cm-1 1432 84m1102 030m-1736 m-1 2959.97cm-1 1632.68cm-1 793 1381.14cm-1 1088 23cm-1 1000 3000 2500 2000 1500 600 4000 3500 cm-1
Please help to identifying all major peaks in the functional group
region with this IR spectra.
This IR is the synthesis of DEET.
74 1942 2321.37cm-1 882.92m 3678 3472 69cm- 2ホ430m-1 1743.05qm- 3 82㎝1 820T-1 944 cm 887,1 45- 914.060 25 086cm-1 4 07cm-1 - 221 3049.89cm-1 2872 98cm-1 1432 84m1102 030m-1736 m-1 2959.97cm-1 1632.68cm-1 793 1381.14cm-1 1088 23cm-1 1000 3000 2500 2000 1500 600 4000 3500 cm-1
Analyze the following IR spectra and explain the Origin of the major peaks in each spectrum....
 Analyze the following IR spectra and explain the Origin of
the major peaks in each spectrum. The structure and molecular
formula are provided.
5. Molecular formula: CHsO Wave Number, cm 4000 3000 2500 2000 1500 1300 1200 1100 1000 800 10 1 12 13 14 15 Wavedength microns Structure: IUPAC Name: benzaldehyde
Analyze the following IR spectra and explain the Origin of
the major peaks in each spectrum. The structure and molecular
formula are provided.
5. Molecular formula: CHsO Wave Number, cm 4000 3000 2500 2000 1500 1300 1200 1100 1000 800 10 1 12 13 14 15 Wavedength microns Structure: IUPAC Name: benzaldehyde
Organic Chemistry - Using the following IR anaylsis identify the major peaks and possible functio...
 Organic Chemistry - Using the following IR anaylsis identify the
major peaks and possible functional group identity. Using the two
NMR spectra, discuss the integration of peaks, chemical shifts, and
splitting. Using the mass spectra, identify molecular weight and
important fragments to confirm the structure. Draw the fragments
that correspond to each peak in the mass spectra. Draw the
structure of the unknown that corresponds to all available data.
additional information: Unknown ‘J’ is a alkane.
H-NMR multiplet, 1OH triplet,...
Organic Chemistry - Using the following IR anaylsis identify the
major peaks and possible functional group identity. Using the two
NMR spectra, discuss the integration of peaks, chemical shifts, and
splitting. Using the mass spectra, identify molecular weight and
important fragments to confirm the structure. Draw the fragments
that correspond to each peak in the mass spectra. Draw the
structure of the unknown that corresponds to all available data.
additional information: Unknown ‘J’ is a alkane.
H-NMR multiplet, 1OH triplet,...
Identify major peaks from both spectra including any peaks that may support the functional group identity....
 Identify major peaks from both
spectra including any peaks that may support the functional group
identity. Discuss intergration of peaks, chemical shifts and
splitting. What is this unknown?
Identify major peaks from both
spectra including any peaks that may support the functional group
identity. Discuss intergration of peaks, chemical shifts and
splitting. What is this unknown?
 1. shown below are IR spectra of cyclohexanecarbaldehyde (I)
and cyclohexene (II). which of the spectra A and B corresponds to
which structure (I or II)? On each spectrum identify the peaks that
are associated with a specific bond vibration bond by drawing the
functional group for that bond, circling the specific vibrating
bond and drying and arrow from the circled bond to the absorption
peak. include all the C-H bonds.
2. provided below are IR spectra of
1,2,3,6-tetrahydrobenzaldehyde (I)...
1. shown below are IR spectra of cyclohexanecarbaldehyde (I)
and cyclohexene (II). which of the spectra A and B corresponds to
which structure (I or II)? On each spectrum identify the peaks that
are associated with a specific bond vibration bond by drawing the
functional group for that bond, circling the specific vibrating
bond and drying and arrow from the circled bond to the absorption
peak. include all the C-H bonds.
2. provided below are IR spectra of
1,2,3,6-tetrahydrobenzaldehyde (I)...
 Record the IR spectra of the following: carvone, menthone, limonene, cintronellol,citral, and p-cymene. Share data with the other students regarding the other spectra Fill in the chart below with the major peaks found in ench IR spectrum. Assign the major peaks to the functional group present in each compound UUUUUUUUUUUUUU Compound Major IR frequencies Assignments
 A-C please
For each of the following organic compounds, list all of the IR absorption peaks that would be observed based on the bonds and functional groups that are present. Make sure to indicate whether each peak corresponds to a stretch or an out of plane bend. Note: For this question, there is no need to include the wavenumber range for each vibrational mode. [14 points] 1. CN Нас NO2 b. CH OCH3 C. он
For each of the following...
A-C please
For each of the following organic compounds, list all of the IR absorption peaks that would be observed based on the bonds and functional groups that are present. Make sure to indicate whether each peak corresponds to a stretch or an out of plane bend. Note: For this question, there is no need to include the wavenumber range for each vibrational mode. [14 points] 1. CN Нас NO2 b. CH OCH3 C. он
For each of the following...
 2. (2 pts.) Provided below are IR spectra of 1,2,3,6-tetrahydrobenzaldehyde (I) and 3-methyl-2-cyclohexen-1-one (II). Decide which of the IR spectra A and B corresponds to which structure (I or II). On each spectrum, identify the peaks that are associated with a specific bond vibration bond by drawing the functional group for that bond, circling the specific vibrating bond and drawing an arrow from the circled bond to the absorption peak, as appropriate. Include all the C-H bonds. odo and II...
 Identify all major functional groups in the IR spectra Identify all peaks in 1H- and isC-NMR spectra. Identify the molecular mass of the unknown from the mass spectrum Determine the pattern of fragmentation from the mass spectrum Generate a molecular formula Determine the Index of Hydrogen Deficiency Determine the structure of the unknown compound.
 Please help to identifying all major peaks in the functional group
region with this IR spectra.
This IR is the synthesis of DEET.
74 1942 2321.37cm-1 882.92m 3678 3472 69cm- 2ホ430m-1 1743.05qm- 3 82㎝1 820T-1 944 cm 887,1 45- 914.060 25 086cm-1 4 07cm-1 - 221 3049.89cm-1 2872 98cm-1 1432 84m1102 030m-1736 m-1 2959.97cm-1 1632.68cm-1 793 1381.14cm-1 1088 23cm-1 1000 3000 2500 2000 1500 600 4000 3500 cm-1
Please help to identifying all major peaks in the functional group
region with this IR spectra.
This IR is the synthesis of DEET.
74 1942 2321.37cm-1 882.92m 3678 3472 69cm- 2ホ430m-1 1743.05qm- 3 82㎝1 820T-1 944 cm 887,1 45- 914.060 25 086cm-1 4 07cm-1 - 221 3049.89cm-1 2872 98cm-1 1432 84m1102 030m-1736 m-1 2959.97cm-1 1632.68cm-1 793 1381.14cm-1 1088 23cm-1 1000 3000 2500 2000 1500 600 4000 3500 cm-1
 Analyze the following IR spectra and explain the Origin of
the major peaks in each spectrum. The structure and molecular
formula are provided.
5. Molecular formula: CHsO Wave Number, cm 4000 3000 2500 2000 1500 1300 1200 1100 1000 800 10 1 12 13 14 15 Wavedength microns Structure: IUPAC Name: benzaldehyde
Analyze the following IR spectra and explain the Origin of
the major peaks in each spectrum. The structure and molecular
formula are provided.
5. Molecular formula: CHsO Wave Number, cm 4000 3000 2500 2000 1500 1300 1200 1100 1000 800 10 1 12 13 14 15 Wavedength microns Structure: IUPAC Name: benzaldehyde
 Organic Chemistry - Using the following IR anaylsis identify the
major peaks and possible functional group identity. Using the two
NMR spectra, discuss the integration of peaks, chemical shifts, and
splitting. Using the mass spectra, identify molecular weight and
important fragments to confirm the structure. Draw the fragments
that correspond to each peak in the mass spectra. Draw the
structure of the unknown that corresponds to all available data.
additional information: Unknown ‘J’ is a alkane.
H-NMR multiplet, 1OH triplet,...
Organic Chemistry - Using the following IR anaylsis identify the
major peaks and possible functional group identity. Using the two
NMR spectra, discuss the integration of peaks, chemical shifts, and
splitting. Using the mass spectra, identify molecular weight and
important fragments to confirm the structure. Draw the fragments
that correspond to each peak in the mass spectra. Draw the
structure of the unknown that corresponds to all available data.
additional information: Unknown ‘J’ is a alkane.
H-NMR multiplet, 1OH triplet,...
 Identify major peaks from both
spectra including any peaks that may support the functional group
identity. Discuss intergration of peaks, chemical shifts and
splitting. What is this unknown?
Identify major peaks from both
spectra including any peaks that may support the functional group
identity. Discuss intergration of peaks, chemical shifts and
splitting. What is this unknown?
Most questions answered within 3 hours.
-
evaluating an expression using only one digit and + and - as
operators ....3+5-1+7-5+8
-----------------------
stack...
asked 6 minutes ago -
Fiscal policy is the deliberate manipulation of taxes and
government spending to alter GDP, employment, inflation...
asked 5 minutes ago -
Two concentric current loops lie in the same plane. The smaller
loop has a radius of...
asked 34 minutes ago -
1)Which of the following is an
important difference between qualified and nonqualified retirement
plans?
a. Qualified...
asked 45 minutes ago -
What's the streaming business's problem on the
horizon?
asked 1 hour ago -
I need help with writing the conclusion for this online lab
report
Abstract
By testing the...
asked 1 hour ago -
For the reaction 1N2+3H2-----> 2NH3, would the reaction rate
trend be: delta[NH3]/ delta t = -2...
asked 2 hours ago -
Within your current/past organization, identify a problem/issue
and format a design to address same. You may...
asked 2 hours ago -
A sock stuck to the side of a clothes-dryer barrel has a
centripetal acceleration of 24...
asked 3 hours ago -
A perfect gas undergoes an isentropic process such that its
volume doubles. If the ratio of...
asked 3 hours ago -
list the elements in groups 3A to 6A in the same order as in the
periodic...
asked 3 hours ago -
Estimating effect size. Peng and Chen (2014)
evaluated effect size estimates for various tests. In their...
asked 3 hours ago