

Homework Answers
Add Answer to:
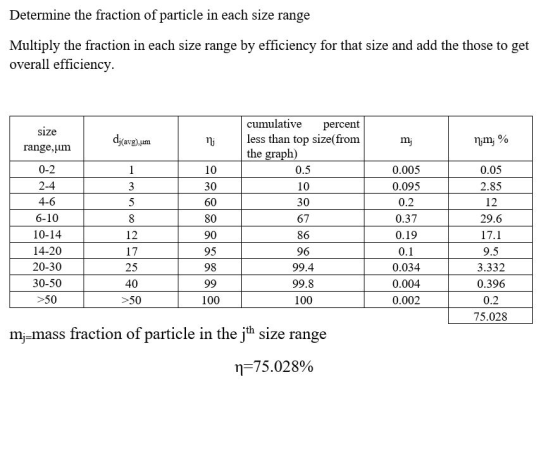
Example 3.3 Assuming that Figure 3.5 is characteristic of the particulates, pre- dict the overall efficiency...
please answer ASAP A technician conducted a grain size test for two soil samples that correspond...
 please answer ASAP
A technician conducted a grain size test for two soil samples that correspond to the two dotted lines in the plot below. Which of the following statement is wrong? 99.99 10,0 99.9 99.5 99 98 9590 LLLLLL 80 70 60 50 40 30 20 10 5 2 1 0.5 Sample 1 Sample 2 Sieve Size, mm 0.10 0.01 0.10.2 12 5 10 90 95 98 99 99.8 20 30 40 50 60 70 80 Cumulative Mass Percent...
please answer ASAP
A technician conducted a grain size test for two soil samples that correspond to the two dotted lines in the plot below. Which of the following statement is wrong? 99.99 10,0 99.9 99.5 99 98 9590 LLLLLL 80 70 60 50 40 30 20 10 5 2 1 0.5 Sample 1 Sample 2 Sieve Size, mm 0.10 0.01 0.10.2 12 5 10 90 95 98 99 99.8 20 30 40 50 60 70 80 Cumulative Mass Percent...
An article of the American Journal of Clinical Pathology, by Metz et al. (A-4) published the...
An article of the American Journal of Clinical Pathology, by Metz et al. (A-4) published the comparison of three methods to determine the percentage of dysmorphic erythrocytes in the urine. They obtained the following results when using the A (X) and B (Y) methods in 75 urine samples. Draw a scatter diagram and obtain the regression equation and graph it on the diagram. X Y X Y X Y X Y 0 0 20 16 65 55 89 81 0 ...
(Figure 13.4) A price taker will choose to employ workers. Wage 100 90 80 70 60...
 (Figure 13.4) A price taker will choose to employ workers. Wage 100 90 80 70 60 50 40 30 20 10 ME MRP 10 20 30 40 50 60 70 80 90 100 Quantity of labor 40 60 50 25
4. A solution containing 0.2 g of glucose/cm3 is passed through packed bed of alumina at...
 4. A solution containing 0.2 g of glucose/cm3 is passed through packed bed of alumina at a flow rate of 10 cm3/s. The breakpoint concentration is set at C/Co 0.01. The breakthrough curve data obtained are given in Table 4. Table 4 Concentration at the outlet (C) (g of glucose/cm) t (min) C 10 C 20 0.01 30 0,025 40 0.05 0.07 50 60 0.1 70 0.13 80 0.15 0.175 0.19 90 100 110 0.2 0.2 0.2 120 140 160...
identify the following compounds from their mass spectra and the data provided. only 10.5 and 10.9...
 identify the following compounds from their mass spectra and
the data provided.
only 10.5 and 10.9
10:53 AM Tue Nov 19 100% Undergraduate Instrumental Analysis (PDFDrive.com) Done Identify the following compounds from their mass spectra and the data provided: 10.4 m/z 28 29 30 31 32 33 34 0.98 Relative abundance 6.3 64 3.8 100 66 0.14 10.5 m/z 14 15 19 31 32 34 35 Relative abundance 17 100 1.0 2.0 10 9.3 89 95 1.1 34 100 33...
identify the following compounds from their mass spectra and
the data provided.
only 10.5 and 10.9
10:53 AM Tue Nov 19 100% Undergraduate Instrumental Analysis (PDFDrive.com) Done Identify the following compounds from their mass spectra and the data provided: 10.4 m/z 28 29 30 31 32 33 34 0.98 Relative abundance 6.3 64 3.8 100 66 0.14 10.5 m/z 14 15 19 31 32 34 35 Relative abundance 17 100 1.0 2.0 10 9.3 89 95 1.1 34 100 33...
un has been built to protect homes in a floodplain until a major channel project can...
 un has been built to protect homes in a floodplain until a major channel project can be A cofferdam has been built to protect home completed. The cofferdam was built for the 20-yT years to complete. (a) What is the probability that the co years? S the probability that the cofferdam will not be overtopped during the entire three Pexo = 1-1/20 =0.95 (b) / What is the risk to the cofferdam? R=1-(1-0.05) R=0.142625 = 14.26% ) What is the...
not sure on this answrer, any help? The graph below is an ogive of scores on...
 not sure on this answrer, any help?
The graph below is an ogive of scores on a math test. The vertical axis in an ogive is the cumulative relative frequency and can also be interpreted as a percentile. Use the graph to approximate the test score that corresponds to the 30th percentile. Percentile Ranks of Math Test Scores O A. 4 B. 9 O C. 56 OD. 50 Percentile 100 90 80 70 60 50 40 30 20 10- 0...
not sure on this answrer, any help?
The graph below is an ogive of scores on a math test. The vertical axis in an ogive is the cumulative relative frequency and can also be interpreted as a percentile. Use the graph to approximate the test score that corresponds to the 30th percentile. Percentile Ranks of Math Test Scores O A. 4 B. 9 O C. 56 OD. 50 Percentile 100 90 80 70 60 50 40 30 20 10- 0...
mた 731 100 417 561 60 65 70 75 40 45 50 Problem 2.9 Spectrum G...
 mた 731 100 417 561 60 65 70 75 40 45 50 Problem 2.9 Spectrum G 95 90 wavenumber (ara) Problem 3.4 G 2.7 2.6 2.5 2.4 2.3 22 2.1 2.0 19 18 1.7 1.6 15 14 1.3 12 11 1.0 09 08 ppm 95 90 85 80 75 70 65 60 55 50 45 40 35 30 25 20 15 10 ppm
(c). Cyclic alcohols may undergo fragmentation by at least three different pathways. Based on the following...
 (c). Cyclic alcohols may undergo fragmentation by at least three different pathways. Based on the following mass spectrum, show THREE (3) fragmentation pathways for cyclohexanol. 57 100 80- OH M.W. = 100 60- 82 Relative Abundance 40- 20 lilia M (100) 99 10 15 20 25 30 35 40 45 50 55 60 65 70 75 80 B5 90 95 100 m/ (10 marks)
Households in China save 40 percent of their annual incomes each year, whereas U.S. households save...
 Households in China save 40 percent of their annual incomes each year, whereas U.S. households save less than 5 percent. At the same time, production possibilities are growing at roughly 9 percent per year in China but only about 3.5 percent in the United States. Use the graphical analysis of "present goods" versus "future goods" to explain the difference between China's growth rate and the U.S. growth rate. Production Possibilities (China) Production Possibilities (United States) 100 100 … 0ppc 80...
 please answer ASAP
A technician conducted a grain size test for two soil samples that correspond to the two dotted lines in the plot below. Which of the following statement is wrong? 99.99 10,0 99.9 99.5 99 98 9590 LLLLLL 80 70 60 50 40 30 20 10 5 2 1 0.5 Sample 1 Sample 2 Sieve Size, mm 0.10 0.01 0.10.2 12 5 10 90 95 98 99 99.8 20 30 40 50 60 70 80 Cumulative Mass Percent...
please answer ASAP
A technician conducted a grain size test for two soil samples that correspond to the two dotted lines in the plot below. Which of the following statement is wrong? 99.99 10,0 99.9 99.5 99 98 9590 LLLLLL 80 70 60 50 40 30 20 10 5 2 1 0.5 Sample 1 Sample 2 Sieve Size, mm 0.10 0.01 0.10.2 12 5 10 90 95 98 99 99.8 20 30 40 50 60 70 80 Cumulative Mass Percent...
 (Figure 13.4) A price taker will choose to employ workers. Wage 100 90 80 70 60 50 40 30 20 10 ME MRP 10 20 30 40 50 60 70 80 90 100 Quantity of labor 40 60 50 25
 4. A solution containing 0.2 g of glucose/cm3 is passed through packed bed of alumina at a flow rate of 10 cm3/s. The breakpoint concentration is set at C/Co 0.01. The breakthrough curve data obtained are given in Table 4. Table 4 Concentration at the outlet (C) (g of glucose/cm) t (min) C 10 C 20 0.01 30 0,025 40 0.05 0.07 50 60 0.1 70 0.13 80 0.15 0.175 0.19 90 100 110 0.2 0.2 0.2 120 140 160...
 identify the following compounds from their mass spectra and
the data provided.
only 10.5 and 10.9
10:53 AM Tue Nov 19 100% Undergraduate Instrumental Analysis (PDFDrive.com) Done Identify the following compounds from their mass spectra and the data provided: 10.4 m/z 28 29 30 31 32 33 34 0.98 Relative abundance 6.3 64 3.8 100 66 0.14 10.5 m/z 14 15 19 31 32 34 35 Relative abundance 17 100 1.0 2.0 10 9.3 89 95 1.1 34 100 33...
identify the following compounds from their mass spectra and
the data provided.
only 10.5 and 10.9
10:53 AM Tue Nov 19 100% Undergraduate Instrumental Analysis (PDFDrive.com) Done Identify the following compounds from their mass spectra and the data provided: 10.4 m/z 28 29 30 31 32 33 34 0.98 Relative abundance 6.3 64 3.8 100 66 0.14 10.5 m/z 14 15 19 31 32 34 35 Relative abundance 17 100 1.0 2.0 10 9.3 89 95 1.1 34 100 33...
 un has been built to protect homes in a floodplain until a major channel project can be A cofferdam has been built to protect home completed. The cofferdam was built for the 20-yT years to complete. (a) What is the probability that the co years? S the probability that the cofferdam will not be overtopped during the entire three Pexo = 1-1/20 =0.95 (b) / What is the risk to the cofferdam? R=1-(1-0.05) R=0.142625 = 14.26% ) What is the...
 not sure on this answrer, any help?
The graph below is an ogive of scores on a math test. The vertical axis in an ogive is the cumulative relative frequency and can also be interpreted as a percentile. Use the graph to approximate the test score that corresponds to the 30th percentile. Percentile Ranks of Math Test Scores O A. 4 B. 9 O C. 56 OD. 50 Percentile 100 90 80 70 60 50 40 30 20 10- 0...
not sure on this answrer, any help?
The graph below is an ogive of scores on a math test. The vertical axis in an ogive is the cumulative relative frequency and can also be interpreted as a percentile. Use the graph to approximate the test score that corresponds to the 30th percentile. Percentile Ranks of Math Test Scores O A. 4 B. 9 O C. 56 OD. 50 Percentile 100 90 80 70 60 50 40 30 20 10- 0...
 mた 731 100 417 561 60 65 70 75 40 45 50 Problem 2.9 Spectrum G 95 90 wavenumber (ara) Problem 3.4 G 2.7 2.6 2.5 2.4 2.3 22 2.1 2.0 19 18 1.7 1.6 15 14 1.3 12 11 1.0 09 08 ppm 95 90 85 80 75 70 65 60 55 50 45 40 35 30 25 20 15 10 ppm
 (c). Cyclic alcohols may undergo fragmentation by at least three different pathways. Based on the following mass spectrum, show THREE (3) fragmentation pathways for cyclohexanol. 57 100 80- OH M.W. = 100 60- 82 Relative Abundance 40- 20 lilia M (100) 99 10 15 20 25 30 35 40 45 50 55 60 65 70 75 80 B5 90 95 100 m/ (10 marks)
 Households in China save 40 percent of their annual incomes each year, whereas U.S. households save less than 5 percent. At the same time, production possibilities are growing at roughly 9 percent per year in China but only about 3.5 percent in the United States. Use the graphical analysis of "present goods" versus "future goods" to explain the difference between China's growth rate and the U.S. growth rate. Production Possibilities (China) Production Possibilities (United States) 100 100 … 0ppc 80...
Most questions answered within 3 hours.
-
Although Epicurus advocates pursuing pleasure for the
good life, discuss a few reasons why he does...
asked 12 minutes ago -
Problem 1: Present entries to record the selected transactions
described below:
(a)
Issued $2,790,000 of 5-year,...
asked 19 minutes ago -
Using technology to support HR activities increases:
a.
the efficiency of the administrative HR functions.
b....
asked 19 minutes ago -
1. List the features used to classify leaf
types.
2. List some characteristics that are shared...
asked 24 minutes ago -
The three elements of Value Proposition, Key Customers, and
Capabilities operate within an environment. Which of...
asked 27 minutes ago -
Katelynn, a physician, earns $200,000 from her medical practice
in the current year. She receives $45,000...
asked 34 minutes ago -
Each row of the table below describes an aqueous solution at
25°C
.
The second column...
asked 39 minutes ago -
A horizontal wire is at y = 0. Current travels in the +x
direction. The magnetic...
asked 39 minutes ago -
Let X be a continuous random variable whose PDF is Let X be a
continuous random...
asked 1 hour ago -
Martinez Company’s relevant range of production is 7,500 units
to 12,500 units. When it produces and...
asked 58 minutes ago -
A football with a mass of 1.2 kg is kicked from ground level to
a height...
asked 1 hour ago -
Remember: Changes in supply determinants shift supply, and
changes in demand determinants shift demand. We say...
asked 1 hour ago