![Problem 7. [MAILABⓒproblem] Write a short MATLAB script to construct the transfer function of a system that is described by t](http://img.homeworklib.com/questions/180594e0-bb3b-11ea-b5de-83a0e31c7950.png?x-oss-process=image/resize,w_560)
Homework Answers
![clc: 2clear all: 3close all; Z=[-1 1+21 1-21]; P=[-2-21-2+21-0.4]; K=1.28; G-zpk (Z, %defining zeros of system %defining pole](http://img.homeworklib.com/questions/39662460-bb3b-11ea-9d75-813050d98556.png?x-oss-process=image/resize,w_560)
Hope this helps..
Add Answer to:
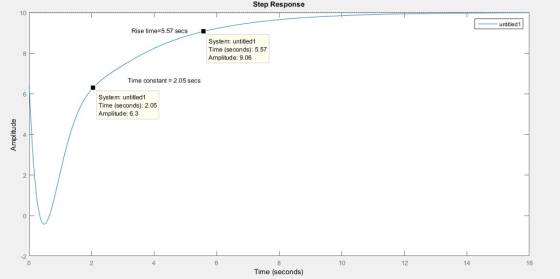
Problem 7. [MAILABⓒproblem] Write a short MATLAB script to construct the transfer function of a system...
Signals and System: MATLAB code provided? Begin with the MATLAB script named lab4.m as follows. You...
 Signals and System: MATLAB code provided?
Begin with the MATLAB script named lab4.m as follows. You will modify this example code to cover each of the parts of this lab. You must always carefully document and include appropriate comments in any MATLAB code. & starting point for Lab#4 % LAPLACE TRANSFORM %---------- clear all; close all; -------------------- s = tf('s'); sys = 1/(5+1); & define H(s) for a dynamic system named sys ---------------- figure(1); bode (sys); % plot magnitude and...
Signals and System: MATLAB code provided?
Begin with the MATLAB script named lab4.m as follows. You will modify this example code to cover each of the parts of this lab. You must always carefully document and include appropriate comments in any MATLAB code. & starting point for Lab#4 % LAPLACE TRANSFORM %---------- clear all; close all; -------------------- s = tf('s'); sys = 1/(5+1); & define H(s) for a dynamic system named sys ---------------- figure(1); bode (sys); % plot magnitude and...
Show Matlab plot comparasion properly please 2) Let a system with an LTI model be 100...
 Show Matlab plot comparasion properly please
2) Let a system with an LTI model be 100 G(s) = 2s2 + 24s + 200 a) Determine the zeros, poles, the steady state step response (aka DC gain), the damping ratio, and the natural frequency b) Find the step response of the system manually and plot the y(t) signal on Matlab c) Use Simulink to simulate the same step response and compare both by taking the L2 norm of the error between...
Show Matlab plot comparasion properly please
2) Let a system with an LTI model be 100 G(s) = 2s2 + 24s + 200 a) Determine the zeros, poles, the steady state step response (aka DC gain), the damping ratio, and the natural frequency b) Find the step response of the system manually and plot the y(t) signal on Matlab c) Use Simulink to simulate the same step response and compare both by taking the L2 norm of the error between...
Problem 1: The impulse response ht) for a particular LTI system is shown below hit) Be5e (4 cos(3...
 Problem 1: The impulse response ht) for a particular LTI system is shown below hit) Be5e (4 cos(3t)+ 6 sin(3t) e. u(t) 1. Plot the impulse response for h(t) directly from the above equation by creating a time vector 2. Use the residue function to determine the transfer function H(s). Determine the locations of the poles and zeros of H(s) with the roots function, and plot them in the s-plane (x for poles, o for zeros). Use the freas function...
1. Write a short MATLAB script or function (m-file) that generates the functions (t)eu(t) for a =...
 Only calculate manually
1. Write a short MATLAB script or function (m-file) that generates the functions (t)eu(t) for a = 0.1. Plot the value of x(t). Since the e-af almost attenuates to 0 after 5T, where T1. So make your time vector from 0 to 5T would be enough to capture the signal.) 2. Using the definition of the FT (1), manually calculate the FT of the given functions in previous exercise 0O x(t)e 3. Plot the absolute values and...
Only calculate manually
1. Write a short MATLAB script or function (m-file) that generates the functions (t)eu(t) for a = 0.1. Plot the value of x(t). Since the e-af almost attenuates to 0 after 5T, where T1. So make your time vector from 0 to 5T would be enough to capture the signal.) 2. Using the definition of the FT (1), manually calculate the FT of the given functions in previous exercise 0O x(t)e 3. Plot the absolute values and...
alpha = 5.0 beta = 7.1 zeta = 6.9 PROBLEM 1 (20 points). Given the filter with transfer function +28-1+-2 11(2) = 1-(α/10)2-4 (a2/100):-2 Use MATLAB to Find the zeros and poles of H() Plot the pole...
 alpha = 5.0
beta = 7.1
zeta = 6.9
PROBLEM 1 (20 points). Given the filter with transfer function +28-1+-2 11(2) = 1-(α/10)2-4 (a2/100):-2 Use MATLAB to Find the zeros and poles of H() Plot the poles and zeros on the -plane. The pot should include the uit circle. Plot the magnitude response (in dB) Plot the phase response. Deliverables: Your MATLAB code used to solve Problem 1 and all the generated plots.
PROBLEM 1 (20 points). Given the filter...
alpha = 5.0
beta = 7.1
zeta = 6.9
PROBLEM 1 (20 points). Given the filter with transfer function +28-1+-2 11(2) = 1-(α/10)2-4 (a2/100):-2 Use MATLAB to Find the zeros and poles of H() Plot the poles and zeros on the -plane. The pot should include the uit circle. Plot the magnitude response (in dB) Plot the phase response. Deliverables: Your MATLAB code used to solve Problem 1 and all the generated plots.
PROBLEM 1 (20 points). Given the filter...
PROBLEM 1 Consider the transfer function T(S) =s5 +2s4 + 2s3 + 4s2 + s + 2 a) Using the Routh-Hurwitz method, determine whether the system is stable. If it is not stable, how many poles are in the...
 PROBLEM 1 Consider the transfer function T(S) =s5 +2s4 + 2s3 + 4s2 + s + 2 a) Using the Routh-Hurwitz method, determine whether the system is stable. If it is not stable, how many poles are in the right-half plane? b) Using MATLAB, compute the poles of T(s) and verify the result in part a) c) Plot the unit step response and discuss the results. (Report should include: Code, Figure 1.Unit step response, answers and conclusion)
PROBLEM 1 Consider...
PROBLEM 1 Consider the transfer function T(S) =s5 +2s4 + 2s3 + 4s2 + s + 2 a) Using the Routh-Hurwitz method, determine whether the system is stable. If it is not stable, how many poles are in the right-half plane? b) Using MATLAB, compute the poles of T(s) and verify the result in part a) c) Plot the unit step response and discuss the results. (Report should include: Code, Figure 1.Unit step response, answers and conclusion)
PROBLEM 1 Consider...
Consider the system 0.28 +0.2x + 2x = f(t), where f(t) is a unit step function,...
 Consider the system 0.28 +0.2x + 2x = f(t), where f(t) is a unit step function, and the initial conditions are zero. (a) Use MATLAB to plot the step response of the system. Attach the MATLAB plot and the script used to create the plot. Using only the printed MATLAB plot, extract by hand (i.e. use a ruler) the (b) maximum percent overshoot, (c) rise time, and (d) peak time, and then using the extracted values, estimate the (e) damping...
Consider the automobile cruise-control system shown below: Engine ActuatorCarburetor 0.833 and load 40 3s +1 Compensator R(s)E(s) Ge(s) s +1 -t e(t) Sensor 0.03 1) Derive the closed-loop transfer fun...
 Consider the automobile cruise-control system shown below: Engine ActuatorCarburetor 0.833 and load 40 3s +1 Compensator R(s)E(s) Ge(s) s +1 -t e(t) Sensor 0.03 1) Derive the closed-loop transfer function of V(s)/R(s) when Gc(s)-1 2) Derive the closed-loop transfer function of E(s)/R(s) when Ge(s)-1 3) Plot the time history of the error e(t) of the closed-loop system when r(t) is a unit step input. 4) Plot the root-loci of the uncompensated system (when Gc(s)-1). Mark the closed-loop complex poles on...
1. Consider a transfer function of a system 25 s? + 4s + 25 a) Simulation...
 1. Consider a transfer function of a system 25 s? + 4s + 25 a) Simulation i. Using any simulation software package, plot the poles on the s-plane. ii. Using unit step input, plot the transient response when there is no additional third pole to the system. iii. Using unit step input, plot the transient response when there is an additional third pole occur at -200, -20, -10, and -2. Plot them in a single graph. Normalize all the plots...
Please solve these using matlab Problem 1 Given the transfer functions e S +5 (a) C(s)...
 Please solve these using matlab
Problem 1 Given the transfer functions e S +5 (a) C(s) 20 S + 20 (b) Use the step function to determine the time constant and rise time for each system. Note: estimate these values from the plot and do not use the stepinfo function. Problem 2 Given the transfer function 100 G(S) = 22 +45 + 25 a. Use the plot resulting from the step function in MATLAB to determine the percent overshoot, settling...
Please solve these using matlab
Problem 1 Given the transfer functions e S +5 (a) C(s) 20 S + 20 (b) Use the step function to determine the time constant and rise time for each system. Note: estimate these values from the plot and do not use the stepinfo function. Problem 2 Given the transfer function 100 G(S) = 22 +45 + 25 a. Use the plot resulting from the step function in MATLAB to determine the percent overshoot, settling...
 Signals and System: MATLAB code provided?
Begin with the MATLAB script named lab4.m as follows. You will modify this example code to cover each of the parts of this lab. You must always carefully document and include appropriate comments in any MATLAB code. & starting point for Lab#4 % LAPLACE TRANSFORM %---------- clear all; close all; -------------------- s = tf('s'); sys = 1/(5+1); & define H(s) for a dynamic system named sys ---------------- figure(1); bode (sys); % plot magnitude and...
Signals and System: MATLAB code provided?
Begin with the MATLAB script named lab4.m as follows. You will modify this example code to cover each of the parts of this lab. You must always carefully document and include appropriate comments in any MATLAB code. & starting point for Lab#4 % LAPLACE TRANSFORM %---------- clear all; close all; -------------------- s = tf('s'); sys = 1/(5+1); & define H(s) for a dynamic system named sys ---------------- figure(1); bode (sys); % plot magnitude and...
 Show Matlab plot comparasion properly please
2) Let a system with an LTI model be 100 G(s) = 2s2 + 24s + 200 a) Determine the zeros, poles, the steady state step response (aka DC gain), the damping ratio, and the natural frequency b) Find the step response of the system manually and plot the y(t) signal on Matlab c) Use Simulink to simulate the same step response and compare both by taking the L2 norm of the error between...
Show Matlab plot comparasion properly please
2) Let a system with an LTI model be 100 G(s) = 2s2 + 24s + 200 a) Determine the zeros, poles, the steady state step response (aka DC gain), the damping ratio, and the natural frequency b) Find the step response of the system manually and plot the y(t) signal on Matlab c) Use Simulink to simulate the same step response and compare both by taking the L2 norm of the error between...
 Problem 1: The impulse response ht) for a particular LTI system is shown below hit) Be5e (4 cos(3t)+ 6 sin(3t) e. u(t) 1. Plot the impulse response for h(t) directly from the above equation by creating a time vector 2. Use the residue function to determine the transfer function H(s). Determine the locations of the poles and zeros of H(s) with the roots function, and plot them in the s-plane (x for poles, o for zeros). Use the freas function...
 Only calculate manually
1. Write a short MATLAB script or function (m-file) that generates the functions (t)eu(t) for a = 0.1. Plot the value of x(t). Since the e-af almost attenuates to 0 after 5T, where T1. So make your time vector from 0 to 5T would be enough to capture the signal.) 2. Using the definition of the FT (1), manually calculate the FT of the given functions in previous exercise 0O x(t)e 3. Plot the absolute values and...
Only calculate manually
1. Write a short MATLAB script or function (m-file) that generates the functions (t)eu(t) for a = 0.1. Plot the value of x(t). Since the e-af almost attenuates to 0 after 5T, where T1. So make your time vector from 0 to 5T would be enough to capture the signal.) 2. Using the definition of the FT (1), manually calculate the FT of the given functions in previous exercise 0O x(t)e 3. Plot the absolute values and...
 alpha = 5.0
beta = 7.1
zeta = 6.9
PROBLEM 1 (20 points). Given the filter with transfer function +28-1+-2 11(2) = 1-(α/10)2-4 (a2/100):-2 Use MATLAB to Find the zeros and poles of H() Plot the poles and zeros on the -plane. The pot should include the uit circle. Plot the magnitude response (in dB) Plot the phase response. Deliverables: Your MATLAB code used to solve Problem 1 and all the generated plots.
PROBLEM 1 (20 points). Given the filter...
alpha = 5.0
beta = 7.1
zeta = 6.9
PROBLEM 1 (20 points). Given the filter with transfer function +28-1+-2 11(2) = 1-(α/10)2-4 (a2/100):-2 Use MATLAB to Find the zeros and poles of H() Plot the poles and zeros on the -plane. The pot should include the uit circle. Plot the magnitude response (in dB) Plot the phase response. Deliverables: Your MATLAB code used to solve Problem 1 and all the generated plots.
PROBLEM 1 (20 points). Given the filter...
 PROBLEM 1 Consider the transfer function T(S) =s5 +2s4 + 2s3 + 4s2 + s + 2 a) Using the Routh-Hurwitz method, determine whether the system is stable. If it is not stable, how many poles are in the right-half plane? b) Using MATLAB, compute the poles of T(s) and verify the result in part a) c) Plot the unit step response and discuss the results. (Report should include: Code, Figure 1.Unit step response, answers and conclusion)
PROBLEM 1 Consider...
PROBLEM 1 Consider the transfer function T(S) =s5 +2s4 + 2s3 + 4s2 + s + 2 a) Using the Routh-Hurwitz method, determine whether the system is stable. If it is not stable, how many poles are in the right-half plane? b) Using MATLAB, compute the poles of T(s) and verify the result in part a) c) Plot the unit step response and discuss the results. (Report should include: Code, Figure 1.Unit step response, answers and conclusion)
PROBLEM 1 Consider...
 Consider the system 0.28 +0.2x + 2x = f(t), where f(t) is a unit step function, and the initial conditions are zero. (a) Use MATLAB to plot the step response of the system. Attach the MATLAB plot and the script used to create the plot. Using only the printed MATLAB plot, extract by hand (i.e. use a ruler) the (b) maximum percent overshoot, (c) rise time, and (d) peak time, and then using the extracted values, estimate the (e) damping...
 Consider the automobile cruise-control system shown below: Engine ActuatorCarburetor 0.833 and load 40 3s +1 Compensator R(s)E(s) Ge(s) s +1 -t e(t) Sensor 0.03 1) Derive the closed-loop transfer function of V(s)/R(s) when Gc(s)-1 2) Derive the closed-loop transfer function of E(s)/R(s) when Ge(s)-1 3) Plot the time history of the error e(t) of the closed-loop system when r(t) is a unit step input. 4) Plot the root-loci of the uncompensated system (when Gc(s)-1). Mark the closed-loop complex poles on...
 1. Consider a transfer function of a system 25 s? + 4s + 25 a) Simulation i. Using any simulation software package, plot the poles on the s-plane. ii. Using unit step input, plot the transient response when there is no additional third pole to the system. iii. Using unit step input, plot the transient response when there is an additional third pole occur at -200, -20, -10, and -2. Plot them in a single graph. Normalize all the plots...
 Please solve these using matlab
Problem 1 Given the transfer functions e S +5 (a) C(s) 20 S + 20 (b) Use the step function to determine the time constant and rise time for each system. Note: estimate these values from the plot and do not use the stepinfo function. Problem 2 Given the transfer function 100 G(S) = 22 +45 + 25 a. Use the plot resulting from the step function in MATLAB to determine the percent overshoot, settling...
Please solve these using matlab
Problem 1 Given the transfer functions e S +5 (a) C(s) 20 S + 20 (b) Use the step function to determine the time constant and rise time for each system. Note: estimate these values from the plot and do not use the stepinfo function. Problem 2 Given the transfer function 100 G(S) = 22 +45 + 25 a. Use the plot resulting from the step function in MATLAB to determine the percent overshoot, settling...
Most questions answered within 3 hours.
-
Humans have used horses for transportation for millions of
years. Therefore, they will use horses for...
asked 1 hour ago -
The following are the Jensen Corporation's unit costs of making
and selling an item at a...
asked 2 hours ago -
Does direct Medicare reimbursement of Advanced practice nurses
increase access to their services?
asked 2 hours ago -
List and explain why a company would choose to use a
published
compensation survey vs. creating...
asked 2 hours ago -
A discrete random variable X can take values from 1 to 10. Find
the variance of...
asked 3 hours ago -
The primary financial goal of a corporation is to maximize:
shareholders wealth.
earnings per share.
stock...
asked 3 hours ago -
determine whether the vectors u=(1,2,3,), v=(-2,1,0) and
w=(1,0,1) are linearly dependent or independent.
asked 3 hours ago -
python
Define a function called print_values which takes a dictionary
object as a parameter. The function...
asked 4 hours ago -
In Chapter 1 you created a program named Triangle in
which you displayed a seven-line triangle...
asked 4 hours ago -
Research question: What are the differences between separately
stated and non separately stated transactions in an...
asked 4 hours ago -
By using Arduino write a code that connects two LEDs to two
push-buttons. Each button controls...
asked 5 hours ago -
Bank of America has bonds that pay a coupon interest rate of 5.5
percent and mature...
asked 6 hours ago