 Household
Paper Plastic
Household
Paper Plastic
1 9.45 3.02
2 6.33 3.86
3 8.72 9.20
4 13.05 12.31
5 12.43 8.57
6 20.12 18.35
7 11.36 10.25
8 5.86 3.91
9 16.08 14.36
10 6.44 8.40
11 11.42 12.81
12 9.55 9.20
13 6.16 5.88
14 2.41 1.13
15 16.39 9.70
16 6.67 6.09
17 6.05 2.73
18 15.09 9.11
19 12.73 14.83
20 9.19 3.74
21 13.31 19.70
22 6.96 7.60
23 7.72 3.86
24 6.98 2.65
25 2.80 5.92
26 17.65 11.26
27 14.33 6.43
28 3.27 0.63
29 6.38 8.82
30 7.57 5.92
Homework Answers
The statistical software output for this problem is:

Hence,
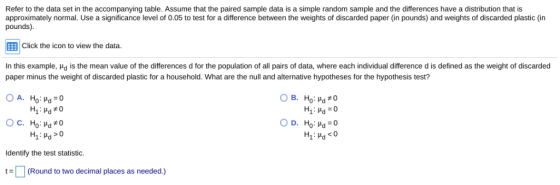
Hypotheses: Option A is correct.
Test statistic = 2.87
P-value = 0.008
Less; Reject; is
Add Answer to:
Household
Paper Plastic
1 9.45 3.02
2 6.33 3.86
3 8.72 9.20
4 13.05 12.31
5 ...
Refer to the data set in the accompanying table. Assume that the paired sample data is...
Refer to the data set in the accompanying table. Assume that the paired sample data is a simple random sample and the differences have a distribution that is approximately normal. Use a significance level of 0.05 to test for a difference between the weights of discarded paper (in pounds) and weights of discarded plastic (in pounds). Household Paper Plastic 1 12.73 14.83 2 13.61 8.95 3 6.96 7.60 4 17.65 11.26 5 11.08 12.47 6 9.83 6.26 7 12.32 11.17...
Refer to the data set in the accompanying table. Assume that the paired sample data is...
Refer to the data set in the accompanying table. Assume that the paired sample data is a simple random sample and the differences have a distribution that is approximately normal. Use a significance level of 0.05 to test for a difference between the weights of discarded paper (in pounds) and weights of discarded plastic (in pounds). Household Paper Plastic 1 13.61 8.95 2 6.98 2.65 3 6.38 8.82 4 6.67 6.09 5 7.57 5.92 6 8.82 11.89 7 3.27 0.63...
Refer to the data set in the accompanying table. Assume that the paired sample data is...
Refer to the data set in the accompanying table. Assume that the paired sample data is a simple random sample and the differences have a distribution that is approximately normal. Use a significance level of 0.10 to test for a difference between the weights of discarded paper (in pounds) and weights of discarded plastic (in pounds). Household Paper Plastic 1 6.16 5.88 2 16.39 9.70 3 6.33 3.86 4 11.36 10.25 5 12.43 8.57 6 7.98 6.09 7 11.42 12.81...
Refer to the data set in the accompanying table. Assume that the paired sample data is...
Refer to the data set in the accompanying table. Assume that the paired sample data is a simple random sample and the differences have a distribution that is approximately normal. Use a significance level of 0.01 to test for a difference between the weights of discarded paper? (in pounds) and weights of discarded plastic? (in pounds). Household Paper Plastic 1 9.41 3.36 2 15.09 9.11 3 6.83 3.57 4 7.98 6.09 5 17.65 11.26 6 7.57 5.92 7 13.31 19.7...
that's all the data i have. Refer to the data set in the accompanying table. Assume...
 that's all the data i have.
Refer to the data set in the accompanying table. Assume that the paired sample data is a simple random sample and the differences have a distribution that is approximately normal. Use a significance level of 0.01 to test for a difference between the weights of discarded paper in pounds) and weights of discarded plastic (in pounds) E Click the icon to view the data. In this example, He is the mean value of the...
that's all the data i have.
Refer to the data set in the accompanying table. Assume that the paired sample data is a simple random sample and the differences have a distribution that is approximately normal. Use a significance level of 0.01 to test for a difference between the weights of discarded paper in pounds) and weights of discarded plastic (in pounds) E Click the icon to view the data. In this example, He is the mean value of the...
A. Based on the confidence interval, can one reject the claim that when the 13th day...
 A.
Based on the confidence interval, can one reject the claim that
when the 13th day of the month falls on a Friday, the numbers of
hospital admissions from motor vehicle crashes are not
affected?
A. Yes, because the confidence interval does not include
zero.
B. No, because the confidence interval includes zero.
B.
C.
D.
P.S Can you please answer part A-D. I am very sick and I can't
think right now. Please help me im begging you. My...
A.
Based on the confidence interval, can one reject the claim that
when the 13th day of the month falls on a Friday, the numbers of
hospital admissions from motor vehicle crashes are not
affected?
A. Yes, because the confidence interval does not include
zero.
B. No, because the confidence interval includes zero.
B.
C.
D.
P.S Can you please answer part A-D. I am very sick and I can't
think right now. Please help me im begging you. My...
Assume that the differences are normally distributed. Complete parts (a) through (d) below. 1 4 5...
 Assume that the differences are normally distributed. Complete parts (a) through (d) below. 1 4 5 Observation X 2 47.2 3 43.6 6 45.6 7 48.2 8 49.6 42.3 46.4 47.9 Y 45.5 46.4 45.7 50.5 50.4 45.7 49.4 49.7 (a) Determine d; = X; - Yfor each pair of data. 1 2 3 4 5 6 7 8 Observation d (Type integers or decimals.) (b) Computed and sa d= (Round to three decimal places as needed.) Sd = (Round...
Assume that the differences are normally distributed. Complete parts (a) through (d) below. 1 4 5...
 Assume that the differences are normally distributed. Complete parts (a) through (d) below. 1 4 5 7 8 Observation X 2 49.1 3 44.6 6 50.8 46.0 49.8 48.8 46.7 50.0 Y 49.4 47.6 46.8 54.6 50.4 50.4 46.8 52.7 (a) Determine d =X-Y for each pair of data. 1 3 4 5 6 7 8 Observation 2 d; (Type integers or decimals.) (b) Computed and sd- (Round to three decimal places as needed.) Sda (Round to three decimal places...
ample Data Item 1 2 3 4 5 Group 1 Group 2 Group 3 13 19...
 ample Data Item 1 2 3 4 5 Group 1 Group 2 Group 3 13 19 16 13 18 14 13 19 16 13 19 15 12 18 15 Print Done p=0.95 D 2 4 5 6 7 8 9 10 D 2 4 5 6 7 8 9 10 11 12 1797 6.08 4.50 3.93 3.64 3.46 3.34 3.26 3.20 3.15 3.11 3.08 3.06 3.03 3.01 3.00 2.98 2.97 2.96 2.95 2.92 2.89 2.86 2.83 2.80 2.77 13 14...
Practice Statistic Final for Spring 201 9 A Name: Do 1, 4, 5, 6,7 Or 2, 3, 5, 6, 7 ONE PROPORTION rowning deaths of children attributed to beaches is given as 0.25. wring deaths of children...
 Practice Statistic Final for Spring 201 9 A Name: Do 1, 4, 5, 6,7 Or 2, 3, 5, 6, 7 ONE PROPORTION rowning deaths of children attributed to beaches is given as 0.25. wring deaths of children has 30% attributed to beaches. 3. The proportion of dro Test the claim that drowning deaths of children attributed to b. Give a 95% Confidence Interval and the EBP. Hypothesis Ho 5 points. 3 points На: p-value Conclusion 6 points b. Give a...
 that's all the data i have.
Refer to the data set in the accompanying table. Assume that the paired sample data is a simple random sample and the differences have a distribution that is approximately normal. Use a significance level of 0.01 to test for a difference between the weights of discarded paper in pounds) and weights of discarded plastic (in pounds) E Click the icon to view the data. In this example, He is the mean value of the...
that's all the data i have.
Refer to the data set in the accompanying table. Assume that the paired sample data is a simple random sample and the differences have a distribution that is approximately normal. Use a significance level of 0.01 to test for a difference between the weights of discarded paper in pounds) and weights of discarded plastic (in pounds) E Click the icon to view the data. In this example, He is the mean value of the...
 A.
Based on the confidence interval, can one reject the claim that
when the 13th day of the month falls on a Friday, the numbers of
hospital admissions from motor vehicle crashes are not
affected?
A. Yes, because the confidence interval does not include
zero.
B. No, because the confidence interval includes zero.
B.
C.
D.
P.S Can you please answer part A-D. I am very sick and I can't
think right now. Please help me im begging you. My...
A.
Based on the confidence interval, can one reject the claim that
when the 13th day of the month falls on a Friday, the numbers of
hospital admissions from motor vehicle crashes are not
affected?
A. Yes, because the confidence interval does not include
zero.
B. No, because the confidence interval includes zero.
B.
C.
D.
P.S Can you please answer part A-D. I am very sick and I can't
think right now. Please help me im begging you. My...
 Assume that the differences are normally distributed. Complete parts (a) through (d) below. 1 4 5 Observation X 2 47.2 3 43.6 6 45.6 7 48.2 8 49.6 42.3 46.4 47.9 Y 45.5 46.4 45.7 50.5 50.4 45.7 49.4 49.7 (a) Determine d; = X; - Yfor each pair of data. 1 2 3 4 5 6 7 8 Observation d (Type integers or decimals.) (b) Computed and sa d= (Round to three decimal places as needed.) Sd = (Round...
 Assume that the differences are normally distributed. Complete parts (a) through (d) below. 1 4 5 7 8 Observation X 2 49.1 3 44.6 6 50.8 46.0 49.8 48.8 46.7 50.0 Y 49.4 47.6 46.8 54.6 50.4 50.4 46.8 52.7 (a) Determine d =X-Y for each pair of data. 1 3 4 5 6 7 8 Observation 2 d; (Type integers or decimals.) (b) Computed and sd- (Round to three decimal places as needed.) Sda (Round to three decimal places...
 ample Data Item 1 2 3 4 5 Group 1 Group 2 Group 3 13 19 16 13 18 14 13 19 16 13 19 15 12 18 15 Print Done p=0.95 D 2 4 5 6 7 8 9 10 D 2 4 5 6 7 8 9 10 11 12 1797 6.08 4.50 3.93 3.64 3.46 3.34 3.26 3.20 3.15 3.11 3.08 3.06 3.03 3.01 3.00 2.98 2.97 2.96 2.95 2.92 2.89 2.86 2.83 2.80 2.77 13 14...
 Practice Statistic Final for Spring 201 9 A Name: Do 1, 4, 5, 6,7 Or 2, 3, 5, 6, 7 ONE PROPORTION rowning deaths of children attributed to beaches is given as 0.25. wring deaths of children has 30% attributed to beaches. 3. The proportion of dro Test the claim that drowning deaths of children attributed to b. Give a 95% Confidence Interval and the EBP. Hypothesis Ho 5 points. 3 points На: p-value Conclusion 6 points b. Give a...
Most questions answered within 3 hours.
-
It is important that face masks used by firefighters be able to
withstand high temperatures because...
asked 13 minutes ago -
explain with the experiment showing one gene one
enzyme hypothesis by tantum and beadle?
asked 12 minutes ago -
test the null hypothesis H0
H0 : In college, the average GPA of men is equal...
asked 41 minutes ago -
Question: Finish task 11) using sed with
back-reference.
11) Use sed to list only the company...
asked 37 minutes ago -
Do a little research on Amazon and share with everyone your view
of its business model...
asked 35 minutes ago -
Discuss the pros and cons to using social media for marketing in
the dealership organizational model...
asked 28 minutes ago -
What is the mole fraction of MgCl2 (95.12 g/mol) in an
aqueous solution that is 5.80...
asked 31 minutes ago -
Based on the brainstorming you have
been doing, share what you’ve come up with and then...
asked 35 minutes ago -
a) For a driver with Vs=10 v with an internal resistance of 50
ohms driving a...
asked 39 minutes ago -
. Suppose that 36 items from a production line are measured. You
don’t know the actual...
asked 42 minutes ago -
Dixie, a driver for Express Delivery Company, leaves the
truck's motor running in neutral and carelessly...
asked 40 minutes ago -
You are the captain of an old-timey warship with 10 cannons. It
takes 4 hits to...
asked 53 minutes ago