
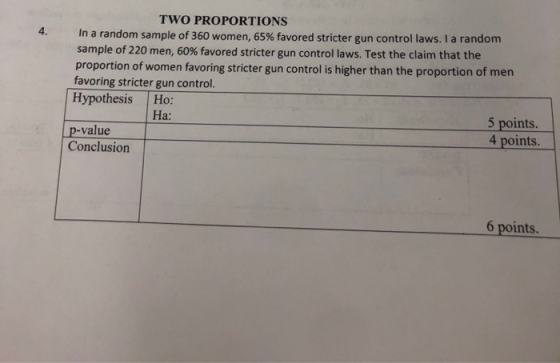


TWO PROPORTIONS In a random sample of 360 women, 65% favored stricter gun control laws. I a random sample of 220 men, 60% favored stricter gun control laws. Test the claim that the proportion of women favoring stricter gun control is higher than the proportion of men favoring stricter gun control. Hypothesis Ho: 4. 5 points. На: 4 points. value Conclusion 6 points.
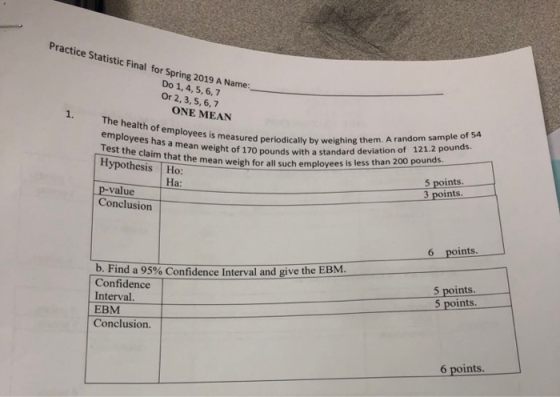
Practice Statistic Final for Spring 2019 A Name: Do 1, 4,5, 6,7 Or 2, 3, 5, 6,7 ONE MEAN 1. The health of employees is measured periodically by wei employees has a mean weight of 170 pounds with a standa Test the claim that the 4 ghing them. A random sample of s e mean weigh for all such employees is less than 200 pounds 5 points 3 points Hypothesis Ho: Ha: p-value Conclusion points 6 BM b. Find a 95% Confidence lnter Confidence Interval. and give the val 5 points 5 points EBM Conclusion. 6 points.
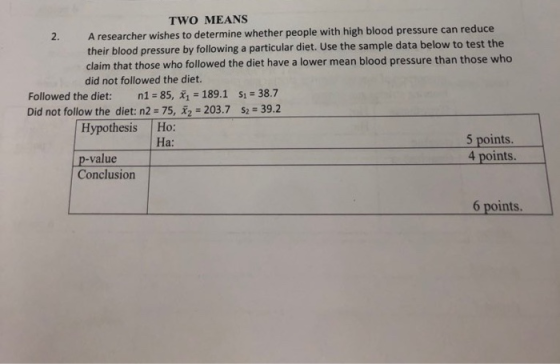
TWO MEANS A researcher wishes to determine whether people with high blood pressure can reduce their blood pressure by following a particular diet. Use the sample data below to test the claim that those who followed the diet have a lower mean blood pressure than those who 2. did not followed the diet. Followed the diet: n1-85, 189.1 s 38.7 Did not follow the diet: n2-75, 3-203.7 S2-39.2 Hypothesis Ho: На: 5 points. 4 points. p-value Conclusion 6 points.
Practice Statistic Final for Spring 2019 A Name: Do 1,4,5,6,7 Or 2, 3, 5, 6,7 5. Chi-Squared Test of Independence Tests for the adverse reactions to a new drug yielded the results given in the table. At the 0.05 significance level, test the claim that the treatment is independent of the reaction (headache or no headache experienced) DrugPlacebo Headache No headache 91 73 Ho: Hypothesis a: 5 points. Expected Values 5 points Decision 5 points Conclusion 5 points.
Perform the indicated Goodness of Fit Test. 6. Using the data below and a 0.05 significance level, test the claim that the responses with percentages of 15%, 20%, 25%, 25%, and 15% respectfully occur Response-la- B- C - D E Frequency 12 15 16 18 19 HypothesisHo На: 5 points Expected Values 5 points. Decision 5 points. Conclusion 5 points.
Practice Do 1, 4, 5, 6,7 Or 2, 3, 5, 6,7 ANOVA. . A consumer magazine wants to compare the lifetimes of ballipoint pens of three different types Brand 1 Brand 2 Brand 3 181 260 238 240 257 218 1184 |162 219 218 213 Does the data indicate that there is a difference in the mean lifetime of the three brands. 241 Hypothesis Ho: На: 5 points. Decision 5 points. Conclusion 5 points.
Homework Answers
7) Here we have data:
| Brand 1 | Brand 2 | Brand 3 |
| 260 | 181 | 238 |
| 218 | 240 | 257 |
| 184 | 162 | 241 |
| 219 | 218 | 213 |
Here we are using Excel for calculation:
| Anova: Single Factor | ||||||
| SUMMARY | ||||||
| Groups | Count | Sum | Average | Variance | ||
| Column 1 | 4 | 881 | 220.25 | 966.9167 | ||
| Column 2 | 4 | 801 | 200.25 | 1242.9167 | ||
| Column 3 | 4 | 949 | 237.25 | 330.9167 | ||
| ANOVA | ||||||
| Source of Variation | SS | df | MS | F | P-value | F crit |
| Between Groups | 2744 | 2 | 1372 | 1.6200 | 0.2507 | 4.2565 |
| Within Groups | 7622.25 | 9 | 846.9167 | |||
| Total | 10366.25 | 11 |
Hypothesis:
Ho; μ1 = μ2 = μ3
Ha; At least one mean is difference from others.
Decision :
Fail to reject the null hypothesis
Conclusion:
Here we have not sufficient evidence to reject the null hypothesis F-observed value is less than F-critical value and P-value is grater than Alpha value.
We can say that yes: All the three brand mean life is same.
(Note:- Dear student according to HomeworkLib policy one question at a time please repost another.)
Add Answer to:
Practice Statistic Final for Spring 201 9 A Name: Do 1, 4, 5, 6,7 Or 2, 3, 5, 6, 7 ONE PROPORTION rowning deaths of children attributed to beaches is given as 0.25. wring deaths of children...
LJidustlc Final for Spring 2019 B Name: Do 1, 4,5,6,7 Or 2,3, 5,6,7 ONE PROPORTION 3. In a clinical study of an allergy drug, 108 of the 202 subjects reported e significant relief from their symp...
 LJidustlc Final for Spring 2019 B Name: Do 1, 4,5,6,7 Or 2,3, 5,6,7 ONE PROPORTION 3. In a clinical study of an allergy drug, 108 of the 202 subjects reported e significant relief from their symptoms. At 0.05 significance level, test th than half of all those using the drug experienced relief. Hypothesis Ho: На: points p-value Conclusion points b. Give a 95% confidence interval. Confidence Interval ЕВР Conclusion TWO PROPORTIONS A marketing survey involves product recognition in New York...
#1-6 Review 4 Name MULTIPLE CHOICE. Choose the one alternative that best completes the statement or...
 #1-6
Review 4 Name MULTIPLE CHOICE. Choose the one alternative that best completes the statement or answers the question. Provide an appropriate response. 1) homeless persons showed that 63 were veterans. Construct a 90% confidence 1) A survey of interval for the proportion of homeless persons who are veterans. D) (0.161, 0.289) C) (0.167,0 283) B) (0.184, 0.266) A) (0.176, 0.274) 2) 2) Given Ho: p z 80% and Ha p: 80% determine whether the hypothesis test is left-tailed right-tailed,...
#1-6
Review 4 Name MULTIPLE CHOICE. Choose the one alternative that best completes the statement or answers the question. Provide an appropriate response. 1) homeless persons showed that 63 were veterans. Construct a 90% confidence 1) A survey of interval for the proportion of homeless persons who are veterans. D) (0.161, 0.289) C) (0.167,0 283) B) (0.184, 0.266) A) (0.176, 0.274) 2) 2) Given Ho: p z 80% and Ha p: 80% determine whether the hypothesis test is left-tailed right-tailed,...
Hotel_Brand_1_Stay_Length Hotel_Brand_2_Stay_Length 4 5 2 1 2 1 1 5 2 9 5 5 4 6...
 Hotel_Brand_1_Stay_Length
Hotel_Brand_2_Stay_Length
4 5
2 1
2 1
1 5
2 9
5 5
4 6
3 4
8 6
1 4
2 3
1 5
2 8
1 3
4 3
2 1
2 9
2 4
1 4
4 2
6 5
1 2
2 2
2 3
3 1
10 1
5 2
4 4
7 3
4 8
2 5
7 5
2 8
2 5
7 4
5 4
1 2
5 3
1 3...
Hotel_Brand_1_Stay_Length
Hotel_Brand_2_Stay_Length
4 5
2 1
2 1
1 5
2 9
5 5
4 6
3 4
8 6
1 4
2 3
1 5
2 8
1 3
4 3
2 1
2 9
2 4
1 4
4 2
6 5
1 2
2 2
2 3
3 1
10 1
5 2
4 4
7 3
4 8
2 5
7 5
2 8
2 5
7 4
5 4
1 2
5 3
1 3...
defects 1 4 1 0 3 4 2 1 3 1 0 5 1 3 3...
 defects
1
4
1
0
3
4
2
1
3
1
0
5
1
3
3
2
1
1
4
1
1
2
3
3
1
2
2
2
2
2
4
3
1
1
3
0
6
1
1
3
2
1
3
3
0
1
0
1
3
5A quality control engineer at a particular lcd screen manufacturer is studying the mean number of defects per screen. Based on historical evidence, the mean number of defects per screen...
defects
1
4
1
0
3
4
2
1
3
1
0
5
1
3
3
2
1
1
4
1
1
2
3
3
1
2
2
2
2
2
4
3
1
1
3
0
6
1
1
3
2
1
3
3
0
1
0
1
3
5A quality control engineer at a particular lcd screen manufacturer is studying the mean number of defects per screen. Based on historical evidence, the mean number of defects per screen...
Job Seeker (k) 1 2 3 4 5 5 6 7 8 9 10 11 12...
 Job Seeker (k) 1 2 3 4 5 5 6 7 8 9 10 11 12 13 14 15 Interviews (Xi) 3 5 114 6 7 6 3 Job Offers (Y) 0 2 1 2 2 4. 3 5 1 4 6 100 7 4 8 1 1 8 4 2 (1) (2 points) Your friend Paul, who took Econ 140A last year, says that you should run a hypothesis test to evaluate Cathy's statement. If the null hypothesis is...
4 5 2 2 0.5 2.5 1 2 3.5 6 1.5 2 1 6.5 7 3...
4 5 2 2 0.5 2.5 1 2 3.5 6 1.5 2 1 6.5 7 3 3 3 1 1.54 6.5 3 2 4 1 2 2 2.5 4 7 1 5 1 2 3 5 7 1 4 6 1.5 2 2 2 2 2 0.5 2 5 4 2 1 2.5 6 2.5 1 4 4 Use the data set provided in the main page of the experience for this application. 1. Complete the full hypothesis testing procedure...
Given are five observations for two variables, r and y. 3 4 5 1 2 7 6 11 14 4 The estimated regression equation is...
 Given are five observations for two variables, r and y. 3 4 5 1 2 7 6 11 14 4 The estimated regression equation is y = 1.2 + 2.4r Compute the mean square error using the following equation (to 3 decimals). a. SSE s2=MSE n- 2 decimals). b. Compute the standard error of the estimate using the following equation (to SSE VMSE Vn-2 SE c. Compute the estimated standard deviation bi using the following equation (to 3 decimals). Sp...
Household Paper Plastic 1 9.45 3.02 2 6.33 3.86 3 8.72 9.20 4 13.05 12.31 5 ...
 Household
Paper Plastic
1 9.45 3.02
2 6.33 3.86
3 8.72 9.20
4 13.05 12.31
5 12.43 8.57
6 20.12 18.35
7 11.36 10.25
8 5.86 3.91
9 16.08 14.36
10 6.44 8.40
11 11.42 12.81
12 9.55 9.20
13 6.16 5.88
14 2.41 1.13
15 16.39 9.70
16 6.67 6.09
17 6.05 2.73
18 15.09 9.11
19 12.73 14.83
20 9.19 3.74
21 13.31 19.70
22 6.96 7.60
23 7.72 3.86
24 6.98 2.65
25 2.80 5.92
26 17.65 ...
Household
Paper Plastic
1 9.45 3.02
2 6.33 3.86
3 8.72 9.20
4 13.05 12.31
5 12.43 8.57
6 20.12 18.35
7 11.36 10.25
8 5.86 3.91
9 16.08 14.36
10 6.44 8.40
11 11.42 12.81
12 9.55 9.20
13 6.16 5.88
14 2.41 1.13
15 16.39 9.70
16 6.67 6.09
17 6.05 2.73
18 15.09 9.11
19 12.73 14.83
20 9.19 3.74
21 13.31 19.70
22 6.96 7.60
23 7.72 3.86
24 6.98 2.65
25 2.80 5.92
26 17.65 ...
"1",4.69816621546105 "2",4.44756510829146 "3",6.84100846766469 "4",7.01358258791867 "5",3.12935822296976 "6",5.14762683649335 "7",2.54905695207...
 "1",4.69816621546105 "2",4.44756510829146 "3",6.84100846766469 "4",7.01358258791867 "5",3.12935822296976 "6",5.14762683649335 "7",2.54905695207479 "8",4.06103182893184 "9",2.48237691955398 "10", 6.2004516591676 "11", 3.01735627817734 "12", 3.54398983209343 "13",5.02652010457958 "14", 5.94118091122925 "15", 7.01208796523191 "16",1.78016831028813 "17",4.33834121978255 "18", 8.93218857046722 "19", 8.43778411332812 "20",8.85822711493131 "21",4.75013154193281 "22", 9.31373767405901 "23",4.09575976019349 "24",2.74688111585186 "25", 3.8040095716617 26",9.34905953037803 "27", 5.87804953966622 "28",7.30637945593767 "29",7.14701470885807 "30",4.48962722844458 "31", 5.04849646123746 "32", 3.97515036133807 "33", 5.32546715405807 "34",8.17769559423788 "35", 6.42260496868865 "36",7.81161965525343 "37",9.8499408616349 "38",9.93608614628273 "39",8.04555405523207 "40",4.14121187997945 "41",5.19842955121368 "42",6.43976800531653 "43", 5.06797870826443 "44",3.79022295456759 "45",8.64229620362652 "46",10.7203765104341 "47",5.45008418851375 "48",4.96026223624637 "49",3.35515355305645 "50",4.3593298786236 Problem 2: Load in the file "data.csv". Assume that this is a random sample from...
STA2221 examples on CI & Testing of Hypothesis Name MULTIPLE CHOICE. Choose the one alternative that...
 STA2221 examples on CI & Testing of Hypothesis Name MULTIPLE CHOICE. Choose the one alternative that best completes the statement or answer the question Provide an appropriate response. 1) Find the critical value,te for 0.99 and n-10. A) 3.250 B) 3.169 1.833 D) 2.262 2) Find the critical value to forc=0.95 and n=16. A) 2.947 B) 2.602 2120 D) 2.131 3) Find the value of E, the margin of error, for A) 1.69 B) 0.42 0.99, n=16 and s=2.6. C)...
 LJidustlc Final for Spring 2019 B Name: Do 1, 4,5,6,7 Or 2,3, 5,6,7 ONE PROPORTION 3. In a clinical study of an allergy drug, 108 of the 202 subjects reported e significant relief from their symptoms. At 0.05 significance level, test th than half of all those using the drug experienced relief. Hypothesis Ho: На: points p-value Conclusion points b. Give a 95% confidence interval. Confidence Interval ЕВР Conclusion TWO PROPORTIONS A marketing survey involves product recognition in New York...
 #1-6
Review 4 Name MULTIPLE CHOICE. Choose the one alternative that best completes the statement or answers the question. Provide an appropriate response. 1) homeless persons showed that 63 were veterans. Construct a 90% confidence 1) A survey of interval for the proportion of homeless persons who are veterans. D) (0.161, 0.289) C) (0.167,0 283) B) (0.184, 0.266) A) (0.176, 0.274) 2) 2) Given Ho: p z 80% and Ha p: 80% determine whether the hypothesis test is left-tailed right-tailed,...
#1-6
Review 4 Name MULTIPLE CHOICE. Choose the one alternative that best completes the statement or answers the question. Provide an appropriate response. 1) homeless persons showed that 63 were veterans. Construct a 90% confidence 1) A survey of interval for the proportion of homeless persons who are veterans. D) (0.161, 0.289) C) (0.167,0 283) B) (0.184, 0.266) A) (0.176, 0.274) 2) 2) Given Ho: p z 80% and Ha p: 80% determine whether the hypothesis test is left-tailed right-tailed,...
 Hotel_Brand_1_Stay_Length
Hotel_Brand_2_Stay_Length
4 5
2 1
2 1
1 5
2 9
5 5
4 6
3 4
8 6
1 4
2 3
1 5
2 8
1 3
4 3
2 1
2 9
2 4
1 4
4 2
6 5
1 2
2 2
2 3
3 1
10 1
5 2
4 4
7 3
4 8
2 5
7 5
2 8
2 5
7 4
5 4
1 2
5 3
1 3...
Hotel_Brand_1_Stay_Length
Hotel_Brand_2_Stay_Length
4 5
2 1
2 1
1 5
2 9
5 5
4 6
3 4
8 6
1 4
2 3
1 5
2 8
1 3
4 3
2 1
2 9
2 4
1 4
4 2
6 5
1 2
2 2
2 3
3 1
10 1
5 2
4 4
7 3
4 8
2 5
7 5
2 8
2 5
7 4
5 4
1 2
5 3
1 3...
 defects
1
4
1
0
3
4
2
1
3
1
0
5
1
3
3
2
1
1
4
1
1
2
3
3
1
2
2
2
2
2
4
3
1
1
3
0
6
1
1
3
2
1
3
3
0
1
0
1
3
5A quality control engineer at a particular lcd screen manufacturer is studying the mean number of defects per screen. Based on historical evidence, the mean number of defects per screen...
defects
1
4
1
0
3
4
2
1
3
1
0
5
1
3
3
2
1
1
4
1
1
2
3
3
1
2
2
2
2
2
4
3
1
1
3
0
6
1
1
3
2
1
3
3
0
1
0
1
3
5A quality control engineer at a particular lcd screen manufacturer is studying the mean number of defects per screen. Based on historical evidence, the mean number of defects per screen...
 Job Seeker (k) 1 2 3 4 5 5 6 7 8 9 10 11 12 13 14 15 Interviews (Xi) 3 5 114 6 7 6 3 Job Offers (Y) 0 2 1 2 2 4. 3 5 1 4 6 100 7 4 8 1 1 8 4 2 (1) (2 points) Your friend Paul, who took Econ 140A last year, says that you should run a hypothesis test to evaluate Cathy's statement. If the null hypothesis is...
 Given are five observations for two variables, r and y. 3 4 5 1 2 7 6 11 14 4 The estimated regression equation is y = 1.2 + 2.4r Compute the mean square error using the following equation (to 3 decimals). a. SSE s2=MSE n- 2 decimals). b. Compute the standard error of the estimate using the following equation (to SSE VMSE Vn-2 SE c. Compute the estimated standard deviation bi using the following equation (to 3 decimals). Sp...
 Household
Paper Plastic
1 9.45 3.02
2 6.33 3.86
3 8.72 9.20
4 13.05 12.31
5 12.43 8.57
6 20.12 18.35
7 11.36 10.25
8 5.86 3.91
9 16.08 14.36
10 6.44 8.40
11 11.42 12.81
12 9.55 9.20
13 6.16 5.88
14 2.41 1.13
15 16.39 9.70
16 6.67 6.09
17 6.05 2.73
18 15.09 9.11
19 12.73 14.83
20 9.19 3.74
21 13.31 19.70
22 6.96 7.60
23 7.72 3.86
24 6.98 2.65
25 2.80 5.92
26 17.65 ...
Household
Paper Plastic
1 9.45 3.02
2 6.33 3.86
3 8.72 9.20
4 13.05 12.31
5 12.43 8.57
6 20.12 18.35
7 11.36 10.25
8 5.86 3.91
9 16.08 14.36
10 6.44 8.40
11 11.42 12.81
12 9.55 9.20
13 6.16 5.88
14 2.41 1.13
15 16.39 9.70
16 6.67 6.09
17 6.05 2.73
18 15.09 9.11
19 12.73 14.83
20 9.19 3.74
21 13.31 19.70
22 6.96 7.60
23 7.72 3.86
24 6.98 2.65
25 2.80 5.92
26 17.65 ...
 "1",4.69816621546105 "2",4.44756510829146 "3",6.84100846766469 "4",7.01358258791867 "5",3.12935822296976 "6",5.14762683649335 "7",2.54905695207479 "8",4.06103182893184 "9",2.48237691955398 "10", 6.2004516591676 "11", 3.01735627817734 "12", 3.54398983209343 "13",5.02652010457958 "14", 5.94118091122925 "15", 7.01208796523191 "16",1.78016831028813 "17",4.33834121978255 "18", 8.93218857046722 "19", 8.43778411332812 "20",8.85822711493131 "21",4.75013154193281 "22", 9.31373767405901 "23",4.09575976019349 "24",2.74688111585186 "25", 3.8040095716617 26",9.34905953037803 "27", 5.87804953966622 "28",7.30637945593767 "29",7.14701470885807 "30",4.48962722844458 "31", 5.04849646123746 "32", 3.97515036133807 "33", 5.32546715405807 "34",8.17769559423788 "35", 6.42260496868865 "36",7.81161965525343 "37",9.8499408616349 "38",9.93608614628273 "39",8.04555405523207 "40",4.14121187997945 "41",5.19842955121368 "42",6.43976800531653 "43", 5.06797870826443 "44",3.79022295456759 "45",8.64229620362652 "46",10.7203765104341 "47",5.45008418851375 "48",4.96026223624637 "49",3.35515355305645 "50",4.3593298786236 Problem 2: Load in the file "data.csv". Assume that this is a random sample from...
 STA2221 examples on CI & Testing of Hypothesis Name MULTIPLE CHOICE. Choose the one alternative that best completes the statement or answer the question Provide an appropriate response. 1) Find the critical value,te for 0.99 and n-10. A) 3.250 B) 3.169 1.833 D) 2.262 2) Find the critical value to forc=0.95 and n=16. A) 2.947 B) 2.602 2120 D) 2.131 3) Find the value of E, the margin of error, for A) 1.69 B) 0.42 0.99, n=16 and s=2.6. C)...
Most questions answered within 3 hours.
-
Consider the reaction, C3 H8 + O2 --> CO2 + H2O. How many
moles of O2...
asked 1 hour ago -
You and your opponent both roll a fair die. If you both roll the
same number,...
asked 1 hour ago -
In a study of the accuracy of fast food drive-through orders,
Restaurant A had 257 accurate...
asked 1 hour ago -
Identify and describe in detail the four categories of
institutions that could be included in a...
asked 1 hour ago -
In python
class Customer:
def __init__(self, customer_id, last_name, first_name, phone_number, address):
self._customer_id = int(customer_id)
self._last_name =...
asked 1 hour ago -
What is an example of a limitation in implementing a new
ERP system and how it...
asked 1 hour ago -
In a section of 9.7cm of an artery with a radius of 2.6mm there
is a...
asked 1 hour ago -
the two carboxylic acid groups of aspartic acid have different
acidities with pKa values of 2.1...
asked 1 hour ago -
Would CuCO3 aqueous salt combined with calcium chloride
form a solid precipitate? If so, what would...
asked 1 hour ago -
How do ECM Solutions assist in embedding a culture of continuous
improvement in an organization? (Project...
asked 1 hour ago -
Directions
These directions introduce the idea of Essential Questions.
Since this may be a new concept...
asked 1 hour ago -
1.b. Fiscal policy is said to suffer from ‘crowding out’.
Explain what this means and why...
asked 2 hours ago