

Homework Answers
| y | t | Q1 | Q2 | Q3 |
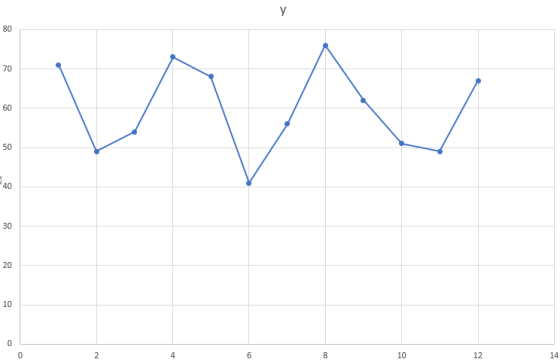
| 71 | 1 | 1 | 0 | 0 |
| 49 | 2 | 0 | 1 | 0 |
| 54 | 3 | 0 | 0 | 1 |
| 73 | 4 | 0 | 0 | 0 |
| 68 | 5 | 1 | 0 | 0 |
| 41 | 6 | 0 | 1 | 0 |
| 56 | 7 | 0 | 0 | 1 |
| 76 | 8 | 0 | 0 | 0 |
| 62 | 9 | 1 | 0 | 0 |
| 51 | 10 | 0 | 1 | 0 |
| 49 | 11 | 0 | 0 | 1 |
| 67 | 12 | 0 | 0 | 0 |
a)
option iii) is correct
b)
| SUMMARY OUTPUT | |||||
| Regression Statistics | |||||
| Multiple R | 0.938765238 | ||||
| R Square | 0.881280172 | ||||
| Adjusted R Square | 0.836760236 | ||||
| Standard Error | 4.55521679 | ||||
| Observations | 12 | ||||
| ANOVA | |||||
| df | SS | MS | F | Significance F | |
| Regression | 3 | 1232.25 | 410.75 | 19.7952 | 0.0005 |
| Residual | 8 | 166 | 20.75 | ||
| Total | 11 | 1398.25 | |||
| Coefficients | Standard Error | t Stat | P-value | Lower 95% | |
| Intercept | 72 | 2.6300 | 27.3769 | 0.0000 | 65.9353 |
| Q1 | -5 | 3.7193 | -1.3443 | 0.2157 | -13.5768 |
| Q2 | -25 | 3.7193 | -6.7217 | 0.0001 | -33.5768 |
| Q3 | -19 | 3.7193 | -5.1085 | 0.0009 | -27.5768 |
y^ = 72 - 5 Q2 -25 Q2 - 19 Q3
c)
| Year | Quarter | Ft |
| 4 | 1 | 67.000 |
| 4 | 2 | 47.000 |
| 4 | 3 | 53.000 |
| 4 | 4 | 72.000 |
Please rate if answers are correct
Add Answer to:
Consider the following time series: Quarter Year 1 Year 2 Year 3 71 68 4941 (a)...
Consider the following time series data. Consider the following time series data. Quarter Year 1 Year...
 Consider the following time series data.
Quarter
Year 1
Year 2
Year 3
1
3
6
8
2
2
4
8
3
4
7
9
4
6
9
11
(a)
Choose the correct time series plot.
(i)
(ii)
(iii)
(iv)
- Select your answer -Plot (i)Plot (ii)Plot (iii)Plot (iv)Item
1
What type of pattern exists in the data?
- Select your answer -Positive trend pattern, no
seasonalityHorizontal pattern, no seasonalityNegative trend
pattern, no seasonalityPositive...
Consider the following time series data.
Consider the following time series data.
Quarter
Year 1
Year 2
Year 3
1
3
6
8
2
2
4
8
3
4
7
9
4
6
9
11
(a)
Choose the correct time series plot.
(i)
(ii)
(iii)
(iv)
- Select your answer -Plot (i)Plot (ii)Plot (iii)Plot (iv)Item
1
What type of pattern exists in the data?
- Select your answer -Positive trend pattern, no
seasonalityHorizontal pattern, no seasonalityNegative trend
pattern, no seasonalityPositive...
E I MINDTAP Video eBook Consider the following time series. Quarter Year 1 Year 2 Year 3 71 49 58 73 68 41 60 86 62 51 53 72 a. Choose a time series plot. TimeSeries Value 60 40 20 TimePer...
 E I MINDTAP Video eBook Consider the following time series. Quarter Year 1 Year 2 Year 3 71 49 58 73 68 41 60 86 62 51 53 72 a. Choose a time series plot. TimeSeries Value 60 40 20 TimePeriod(t) TimeSeries Value -60 40 20 Time Periodit) TimeSeries Value ype here to search TimeSeries Valu 60 40 20 Time Periodt) TimeSeries Vale 40 b. Use the folio ving dummy variables to devel。an estmsted regression munion to accent for seasonal...
Consider the following time series data. Quarter Year 1 Year 2 Year 3 1 4 6...
Consider the following time series data. Quarter Year 1 Year 2 Year 3 1 4 6 7 2 2 3 6 3 3 5 6 4 5 7 8 (b) Use a multiple regression model with dummy variables as follows to develop an equation to account for seasonal effects in the data. Qtr1 = 1 if Quarter 1, 0 otherwise; Qtr2 = 1 if Quarter 2, 0 otherwise; Qtr3 = 1 if Quarter 3, 0 otherwise. If required, round your...
eBook Consider the following time series data. Quarter Year1 Year 2 Year 3 10 10 12...
 eBook Consider the following time series data. Quarter Year1 Year 2 Year 3 10 10 12 Plot (i) What type of pattern exists in the data? Select your answer b) Use a multi le regression model with dummy variables as ollows to develop an equation to account or seasonal effects in the data tri . 1 if uarter 1 0 otherwise; tr2·1 i uarter 2 0 otherwise; tr3-1 if uarter 3 0 otherwise. If requred, round your answers to three...
Consider the following time series data: Quarter Year 1 Year 2 Year 3 1 71 68...
Consider the following time series data: Quarter Year 1 Year 2 Year 3 1 71 68 62 2 49 41 51 3 58 60 53 4 78 81 72 Question: Use a multiple regression linear model with dummy variables as follows to develop an equation to account for seasonal effects in the data: Q1=1 if quarter 1, 0 otherwise Q2=1 if quarter 2, 0 otherwise Q3=1 if quarter 3, 0 otherwise What is the R^2 (coefficient of determination)? Round to...
Consider the following time series data. Quarter Year 1 Year 2 Year 3 1 5 8...
Consider the following time series data. Quarter Year 1 Year 2 Year 3 1 5 8 10 2 1 3 7 3 3 6 8 4 7 10 12 (d) Use a multiple regression model to develop an equation to account for trend and seasonal effects in the data. Use the dummy variables you developed in part (b) to capture seasonal effects and create a variable t such that t = 1 for Quarter 1 in Year 1, t =...
Quarter Year1 Year 2 Year 3 71 49 58 76 68 41 60 78 62 51 53 רך 2 4 a. Choose a time series plot. 2 TimeSeries Value 6 0 40 20 TimePeriod (t) 2 TimeSeries Value 60 4 0 20 TimePeriod(t) 3 TimeSeries...
 Quarter Year1 Year 2 Year 3 71 49 58 76 68 41 60 78 62 51 53 רך 2 4 a. Choose a time series plot. 2 TimeSeries Value 6 0 40 20 TimePeriod (t) 2 TimeSeries Value 60 4 0 20 TimePeriod(t) 3 TimeSeries Value 60 4 20 TimePeriod(t) 4 TimeSeries Value 0 0 20 TimePeriod (t) Select your answer What type of pattern exists in the data? - Select your answer rl uarteră, otherwise: is b. Use the...
video Consider the following time series. Quarter Year 2Year 3 Year 1 71 49 58 75 68 41 60 81 62 51 53 75 a. Choose a time series plot. TimeSeries Value 60 40 20 TimePeriod(t) Time...
 video Consider the following time series. Quarter Year 2Year 3 Year 1 71 49 58 75 68 41 60 81 62 51 53 75 a. Choose a time series plot. TimeSeries Value 60 40 20 TimePeriod(t) TimeSeries Value O Type here to search otps/hg cengage.com/static/nb/uifevo/index.html?deploymentld-57360022185226012174 N-97813371153778id-429851674&snapsho NGAGE MINDTAP er 17 Assignment a. Choose a time series plot. TameSeries Value 60 40 20 24TimePeriod it) TimeSeries Value 60 40 20 TimeSeries Value 60 40 20 TimePeriodit) Time Period it 2 TimeSeries...
Please help I am very confused on how to solve this South Shore Construction builds permanent...
 Please help I am very confused on how to
solve this
South Shore Construction builds permanent docks and seawalls along the southern shore of Long Island, New York. Although the firm has been in business only five years, revenue has increased from $315,000 in the first year of operation to $1,075,000 in the most recent year. The following data show the quarterly sales revenue in thousands of dollars. Quarter Year 1 TE Year 2 Year 3 Year 4 Year 5...
Please help I am very confused on how to
solve this
South Shore Construction builds permanent docks and seawalls along the southern shore of Long Island, New York. Although the firm has been in business only five years, revenue has increased from $315,000 in the first year of operation to $1,075,000 in the most recent year. The following data show the quarterly sales revenue in thousands of dollars. Quarter Year 1 TE Year 2 Year 3 Year 4 Year 5...
Quarter Year 1 Year 2 Year 3 Year 4 Year 5 1 20 42 69 98...
 Quarter
Year 1
Year 2
Year 3
Year 4
Year 5
1
20
42
69
98
175
2
101
141
149
211
288
3
168
250
333
388
436
4
6
20
47
91
181
South Shore Construction builds permanent docks and seawalls along the southern shore of Long Island, New York. Although the firm has been in business only five years, revenue has increased from $295,000 in the first year of operation to $1,080,000 in the most recent year....
Quarter
Year 1
Year 2
Year 3
Year 4
Year 5
1
20
42
69
98
175
2
101
141
149
211
288
3
168
250
333
388
436
4
6
20
47
91
181
South Shore Construction builds permanent docks and seawalls along the southern shore of Long Island, New York. Although the firm has been in business only five years, revenue has increased from $295,000 in the first year of operation to $1,080,000 in the most recent year....
 Consider the following time series data.
Quarter
Year 1
Year 2
Year 3
1
3
6
8
2
2
4
8
3
4
7
9
4
6
9
11
(a)
Choose the correct time series plot.
(i)
(ii)
(iii)
(iv)
- Select your answer -Plot (i)Plot (ii)Plot (iii)Plot (iv)Item
1
What type of pattern exists in the data?
- Select your answer -Positive trend pattern, no
seasonalityHorizontal pattern, no seasonalityNegative trend
pattern, no seasonalityPositive...
Consider the following time series data.
Consider the following time series data.
Quarter
Year 1
Year 2
Year 3
1
3
6
8
2
2
4
8
3
4
7
9
4
6
9
11
(a)
Choose the correct time series plot.
(i)
(ii)
(iii)
(iv)
- Select your answer -Plot (i)Plot (ii)Plot (iii)Plot (iv)Item
1
What type of pattern exists in the data?
- Select your answer -Positive trend pattern, no
seasonalityHorizontal pattern, no seasonalityNegative trend
pattern, no seasonalityPositive...
 E I MINDTAP Video eBook Consider the following time series. Quarter Year 1 Year 2 Year 3 71 49 58 73 68 41 60 86 62 51 53 72 a. Choose a time series plot. TimeSeries Value 60 40 20 TimePeriod(t) TimeSeries Value -60 40 20 Time Periodit) TimeSeries Value ype here to search TimeSeries Valu 60 40 20 Time Periodt) TimeSeries Vale 40 b. Use the folio ving dummy variables to devel。an estmsted regression munion to accent for seasonal...
 eBook Consider the following time series data. Quarter Year1 Year 2 Year 3 10 10 12 Plot (i) What type of pattern exists in the data? Select your answer b) Use a multi le regression model with dummy variables as ollows to develop an equation to account or seasonal effects in the data tri . 1 if uarter 1 0 otherwise; tr2·1 i uarter 2 0 otherwise; tr3-1 if uarter 3 0 otherwise. If requred, round your answers to three...
 Quarter Year1 Year 2 Year 3 71 49 58 76 68 41 60 78 62 51 53 רך 2 4 a. Choose a time series plot. 2 TimeSeries Value 6 0 40 20 TimePeriod (t) 2 TimeSeries Value 60 4 0 20 TimePeriod(t) 3 TimeSeries Value 60 4 20 TimePeriod(t) 4 TimeSeries Value 0 0 20 TimePeriod (t) Select your answer What type of pattern exists in the data? - Select your answer rl uarteră, otherwise: is b. Use the...
 video Consider the following time series. Quarter Year 2Year 3 Year 1 71 49 58 75 68 41 60 81 62 51 53 75 a. Choose a time series plot. TimeSeries Value 60 40 20 TimePeriod(t) TimeSeries Value O Type here to search otps/hg cengage.com/static/nb/uifevo/index.html?deploymentld-57360022185226012174 N-97813371153778id-429851674&snapsho NGAGE MINDTAP er 17 Assignment a. Choose a time series plot. TameSeries Value 60 40 20 24TimePeriod it) TimeSeries Value 60 40 20 TimeSeries Value 60 40 20 TimePeriodit) Time Period it 2 TimeSeries...
 Please help I am very confused on how to
solve this
South Shore Construction builds permanent docks and seawalls along the southern shore of Long Island, New York. Although the firm has been in business only five years, revenue has increased from $315,000 in the first year of operation to $1,075,000 in the most recent year. The following data show the quarterly sales revenue in thousands of dollars. Quarter Year 1 TE Year 2 Year 3 Year 4 Year 5...
Please help I am very confused on how to
solve this
South Shore Construction builds permanent docks and seawalls along the southern shore of Long Island, New York. Although the firm has been in business only five years, revenue has increased from $315,000 in the first year of operation to $1,075,000 in the most recent year. The following data show the quarterly sales revenue in thousands of dollars. Quarter Year 1 TE Year 2 Year 3 Year 4 Year 5...
 Quarter
Year 1
Year 2
Year 3
Year 4
Year 5
1
20
42
69
98
175
2
101
141
149
211
288
3
168
250
333
388
436
4
6
20
47
91
181
South Shore Construction builds permanent docks and seawalls along the southern shore of Long Island, New York. Although the firm has been in business only five years, revenue has increased from $295,000 in the first year of operation to $1,080,000 in the most recent year....
Quarter
Year 1
Year 2
Year 3
Year 4
Year 5
1
20
42
69
98
175
2
101
141
149
211
288
3
168
250
333
388
436
4
6
20
47
91
181
South Shore Construction builds permanent docks and seawalls along the southern shore of Long Island, New York. Although the firm has been in business only five years, revenue has increased from $295,000 in the first year of operation to $1,080,000 in the most recent year....
Most questions answered within 3 hours.
-
You have a 825.3 mL sample of 2.754 M HA (Ka =
4.49⋅10−4). Calculate the pH...
asked 2 hours ago -
The blues made its way into many kinds of music. Eric Clapton,
The Beatles, and Elvis...
asked 5 hours ago -
8. A wave in a string has a wave function given by: y (x, t) =...
asked 4 hours ago -
If you’re standing at the bottom of a hill and asked to evaluate
it while being...
asked 5 hours ago -
1. Which region has taken the lead in the world of
e-waste handling?
a) European Union...
asked 5 hours ago -
A 8.15- g bullet from a 9-mm pistol has a velocity of 366.0 m/s.
It strikes...
asked 7 hours ago -
The outstanding bonds of Alpha Extracts have a yield to maturity
of 7.4 percent and a...
asked 7 hours ago -
The Problem: The Case of the Harmonizing Vacations
Your CEO is exploring partnering with a European...
asked 8 hours ago -
A chemical equation is balanced by adding coefficients in front
of some formulas so that the...
asked 8 hours ago -
From the literature (reference your sources): What are the
lattice parameters of calcite and aragonite? Why...
asked 9 hours ago -
Your system is rejecting the question am asking which is
preceded by a case study. It...
asked 9 hours ago -
3. On January 2, 2000, Larry creates a trust with himself as
trustee. Larry as trustee...
asked 9 hours ago