
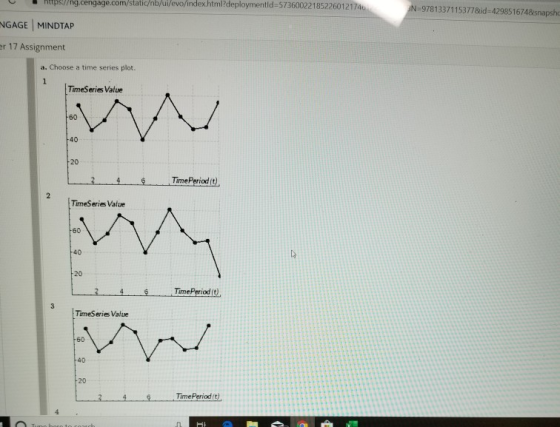


otps/hg cengage.com/static/nb/uifevo/index.html?deploymentld-57360022185226012174 N-97813371153778id-429851674&snapsho NGAGE MINDTAP er 17 Assignment a. Choose a time series plot. TameSeries Value 60 40 20 24TimePeriod it) TimeSeries Value 60 40 20 TimeSeries Value 60 40 20 TimePeriodit)
Time Period it 2 TimeSeries Value 40 TimePeriod (t) - TimeSeries Value 2 4 TimePeriod it) 4 TimeSeries Value 2 4TimePeriodt Tvpe here to search
GAGE MINDTAP Q Search this course r 17 Assignment 40 20 TimePeriodit TimeSeries Value 60 40 20 Select your What type of pattern exists in the data? b. Use the following duminy variables to develop an estimate regression equator ta acont, Qtr3 1 if Quarter 3, 0 otherwise. Enter negative values as negative numbers. Value - c. Compute the quarterly forecasts for next year Quarter 1 forecast Quarter 2 forecast Quarter 3 forecast Quarter 4 forecast or 95ggonal efects n heda s . r srt-1 n il f psrer· ther ser the nisei Qtr1+ Qtr3 Check My Work (2 remaining
mdeploymentld 573600221852260121746122951 8elSBN-9781337 115378id 4298516748snapshotld -10627788 SAGE MINDTAP Q Search this course 17 Assignment 40 20 TimePeriod t) TmeSeries Value 60 40 20 24Time Period it) Select your answer What type of pattern exists in the data? Select your a Select your answer Horizontal regression equation to account for seasonal effects in the dota: Qurl-1 f Quarter 1, 0 ctherwise; Qtr2-1Quarter 2, 0 othe otherwise. Enter negative values as negative numbers Qtri t Qtr2 + Qtr3 forecasts for next year Quarter 1 forecast Quarter 2 forecast Quarter 3 forecast Quarter 4 forecast Check My Work (remain
Homework Answers
A)

correct graph is 1 )
there is seasonality
B)
| Y | t | Q1 | Q2 | Q3 |
| 71 | 1 | 1 | 0 | 0 |
| 49 | 2 | 0 | 1 | 0 |
| 58 | 3 | 0 | 0 | 1 |
| 75 | 4 | 0 | 0 | 0 |
| 68 | 5 | 1 | 0 | 0 |
| 41 | 6 | 0 | 1 | 0 |
| 60 | 7 | 0 | 0 | 1 |
| 81 | 8 | 0 | 0 | 0 |
| 62 | 9 | 1 | 0 | 0 |
| 51 | 10 | 0 | 1 | 0 |
| 53 | 11 | 0 | 0 | 1 |
| 75 | 12 | 0 | 0 | 0 |
Using Excel
| SUMMARY OUTPUT | |||||
| Regression Statistics | |||||
| Multiple R | 0.954040971 | ||||
| R Square | 0.910194175 | ||||
| Adjusted R Square | 0.87651699 | ||||
| Standard Error | 4.301162634 | ||||
| Observations | 12 | ||||
| ANOVA | |||||
| df | SS | MS | F | Significance F | |
| Regression | 3 | 1500 | 500 | 27.02702703 | 0.000154211 |
| Residual | 8 | 148 | 18.5 | ||
| Total | 11 | 1648 | |||
| Coefficients | Standard Error | t Stat | P-value | Lower 95% | |
| Intercept | 77 | 2.483277404 | 31.00740975 | 1.27215E-09 | 71.27355204 |
| Q1 | -10 | 3.511884584 | -2.847473987 | 0.021562653 | -18.09842037 |
| Q2 | -30 | 3.511884584 | -8.542421962 | 2.7151E-05 | -38.09842037 |
| Q3 | -20 | 3.511884584 | -5.694947975 | 0.000457035 | -28.09842037 |
y^ = 77 - 10Qtr1 -30 Qtr2 - 20 Qtr3
| Q1 | 67 |
| Q2 | 47 |
| Q3 | 57 |
| Q4 | 77 |
Add Answer to:
video Consider the following time series. Quarter Year 2Year 3 Year 1 71 49 58 75 68 41 60 81 62 51 53 75 a. Choose a time series plot. TimeSeries Value 60 40 20 TimePeriod(t) Time...
E I MINDTAP Video eBook Consider the following time series. Quarter Year 1 Year 2 Year 3 71 49 58 73 68 41 60 86 62 51 53 72 a. Choose a time series plot. TimeSeries Value 60 40 20 TimePer...
 E I MINDTAP Video eBook Consider the following time series. Quarter Year 1 Year 2 Year 3 71 49 58 73 68 41 60 86 62 51 53 72 a. Choose a time series plot. TimeSeries Value 60 40 20 TimePeriod(t) TimeSeries Value -60 40 20 Time Periodit) TimeSeries Value ype here to search TimeSeries Valu 60 40 20 Time Periodt) TimeSeries Vale 40 b. Use the folio ving dummy variables to devel。an estmsted regression munion to accent for seasonal...
Quarter Year1 Year 2 Year 3 71 49 58 76 68 41 60 78 62 51 53 רך 2 4 a. Choose a time series plot. 2 TimeSeries Value 6 0 40 20 TimePeriod (t) 2 TimeSeries Value 60 4 0 20 TimePeriod(t) 3 TimeSeries...
 Quarter Year1 Year 2 Year 3 71 49 58 76 68 41 60 78 62 51 53 רך 2 4 a. Choose a time series plot. 2 TimeSeries Value 6 0 40 20 TimePeriod (t) 2 TimeSeries Value 60 4 0 20 TimePeriod(t) 3 TimeSeries Value 60 4 20 TimePeriod(t) 4 TimeSeries Value 0 0 20 TimePeriod (t) Select your answer What type of pattern exists in the data? - Select your answer rl uarteră, otherwise: is b. Use the...
Consider the following time series data. 15 13 10 12 a. Which of the following is a correct time series plot for this data? TimeSeries Value 14 12 10 TimePeriod (t) TimeSeries Value 14 12 10 TimePeri...
 Consider the following time series data. 15 13 10 12 a. Which of the following is a correct time series plot for this data? TimeSeries Value 14 12 10 TimePeriod (t) TimeSeries Value 14 12 10 TimePeriod(t) TimeSeries Value 14 12 10 TimePeriod (t) 2 TimePeriod(t) select your answer- What type of pattern exists in the data? -select your answer b. Develop the linear trend equation for this time series (to 1 decimal). Tt = c. What is the forecast...
Consider the following time series: Quarter Year 1 Year 2 Year 3 71 68 4941 (a)...
 Consider the following time series: Quarter Year 1 Year 2 Year 3 71 68 4941 (a) Choose a time series plot. 9 10 11 12 Perodit 8 8 8 8 112 9 10 11 12 Periodit - Select your answer What type of pattern exists in the data? Is there an indication of a seasonal pattern? - Select your answer - (b) Use a multiple linear regression model with dummy variables as follows to develop an equation to account for...
Consider the following time series data 4 10 13 15 a. Which of the following is...
 Consider the following time series data 4 10 13 15 a. Which of the following is a correct time series plot for this data? TimeSeries Value 14 12 10 4 2 TimePeriod(t) TimeSeries Value 14 12 10 4 2 TimePeriod(t) TimeSeries Value 14 7つ TimeSeries Value 14 12 10 8 TimePeriod(t) 3. TimeSeries Value 14 12 10 TimePeriod (t -Select your answer+ What type of pattern exists in the data? -Select your answer- b. Develop the linear trend equation for...
Consider the following time series. t 1 23 4 5 6 7 Yt 83 60 45 36 31 30 34 a. Which of the follow...
 Consider the following time series. t 1 23 4 5 6 7 Yt 83 60 45 36 31 30 34 a. Which of the following is the correct time series plot? TimeSeriesValue 90 80 70 60 50 40 20 10 TimePeriodit 2 I imeSeriesValue 90 80 70 60 50 40 20 10 2 TimePeriodit 3. TimeSeries Value 90 80 60 50 40 30 10 TimePeriodit 4 TimeSeries Value 90 80 70 60 50 40 30 10 2 TimePeriod t -...
Homework Consider the following time series data. Week Value a. Which of the following is a...
 Homework Consider the following time series data. Week Value a. Which of the following is a correct time series plot for this data? 1 18 2 14 3 17 4 12 5 17 6 15 TimeSeries Value 115 Week TimeSeries Value 3 4 5 Week 2 TimeSeries Value 15 3 4 . 5 Week plot #1 What type of pattern exists in the data? Horizontal a Search this course mework Week plot 01 What type of pattern exists in the...
Consider the following time series data. Quarter Year 1 Year 2 Year 3 1 4 6...
Consider the following time series data. Quarter Year 1 Year 2 Year 3 1 4 6 7 2 2 3 6 3 3 5 6 4 5 7 8 (b) Use a multiple regression model with dummy variables as follows to develop an equation to account for seasonal effects in the data. Qtr1 = 1 if Quarter 1, 0 otherwise; Qtr2 = 1 if Quarter 2, 0 otherwise; Qtr3 = 1 if Quarter 3, 0 otherwise. If required, round your...
Consider the following time series data. Consider the following time series data. Quarter Year 1 Year...
 Consider the following time series data.
Quarter
Year 1
Year 2
Year 3
1
3
6
8
2
2
4
8
3
4
7
9
4
6
9
11
(a)
Choose the correct time series plot.
(i)
(ii)
(iii)
(iv)
- Select your answer -Plot (i)Plot (ii)Plot (iii)Plot (iv)Item
1
What type of pattern exists in the data?
- Select your answer -Positive trend pattern, no
seasonalityHorizontal pattern, no seasonalityNegative trend
pattern, no seasonalityPositive...
Consider the following time series data.
Consider the following time series data.
Quarter
Year 1
Year 2
Year 3
1
3
6
8
2
2
4
8
3
4
7
9
4
6
9
11
(a)
Choose the correct time series plot.
(i)
(ii)
(iii)
(iv)
- Select your answer -Plot (i)Plot (ii)Plot (iii)Plot (iv)Item
1
What type of pattern exists in the data?
- Select your answer -Positive trend pattern, no
seasonalityHorizontal pattern, no seasonalityNegative trend
pattern, no seasonalityPositive...
NGAGE INDIAP HW Consider the following time series. 1 2 3 4 5 6 7 82...
 NGAGE INDIAP HW Consider the following time series. 1 2 3 4 5 6 7 82 61 44 34 31 28 34 a. Which of the following is the correct time series plot? 2o TimeSeriesValue 20+ 107 Time Perioditi 90 TimeSeriesValue 80+ 707 NGAGE MINDTAP HW 90 I TimeSeriesValue 80+ 9 & 8 a Time Perioditi 901 TimeSeriesValue SAGE MINDTAP 90 TimeSeries Value $ 88@ $ $ 5 Time Perioditi 20 Timeberies Value MINDTAP Time periode Time Perioditi TimeSeriesValue %...
 E I MINDTAP Video eBook Consider the following time series. Quarter Year 1 Year 2 Year 3 71 49 58 73 68 41 60 86 62 51 53 72 a. Choose a time series plot. TimeSeries Value 60 40 20 TimePeriod(t) TimeSeries Value -60 40 20 Time Periodit) TimeSeries Value ype here to search TimeSeries Valu 60 40 20 Time Periodt) TimeSeries Vale 40 b. Use the folio ving dummy variables to devel。an estmsted regression munion to accent for seasonal...
 Quarter Year1 Year 2 Year 3 71 49 58 76 68 41 60 78 62 51 53 רך 2 4 a. Choose a time series plot. 2 TimeSeries Value 6 0 40 20 TimePeriod (t) 2 TimeSeries Value 60 4 0 20 TimePeriod(t) 3 TimeSeries Value 60 4 20 TimePeriod(t) 4 TimeSeries Value 0 0 20 TimePeriod (t) Select your answer What type of pattern exists in the data? - Select your answer rl uarteră, otherwise: is b. Use the...
 Consider the following time series data. 15 13 10 12 a. Which of the following is a correct time series plot for this data? TimeSeries Value 14 12 10 TimePeriod (t) TimeSeries Value 14 12 10 TimePeriod(t) TimeSeries Value 14 12 10 TimePeriod (t) 2 TimePeriod(t) select your answer- What type of pattern exists in the data? -select your answer b. Develop the linear trend equation for this time series (to 1 decimal). Tt = c. What is the forecast...
 Consider the following time series: Quarter Year 1 Year 2 Year 3 71 68 4941 (a) Choose a time series plot. 9 10 11 12 Perodit 8 8 8 8 112 9 10 11 12 Periodit - Select your answer What type of pattern exists in the data? Is there an indication of a seasonal pattern? - Select your answer - (b) Use a multiple linear regression model with dummy variables as follows to develop an equation to account for...
 Consider the following time series data 4 10 13 15 a. Which of the following is a correct time series plot for this data? TimeSeries Value 14 12 10 4 2 TimePeriod(t) TimeSeries Value 14 12 10 4 2 TimePeriod(t) TimeSeries Value 14 7つ TimeSeries Value 14 12 10 8 TimePeriod(t) 3. TimeSeries Value 14 12 10 TimePeriod (t -Select your answer+ What type of pattern exists in the data? -Select your answer- b. Develop the linear trend equation for...
 Consider the following time series. t 1 23 4 5 6 7 Yt 83 60 45 36 31 30 34 a. Which of the following is the correct time series plot? TimeSeriesValue 90 80 70 60 50 40 20 10 TimePeriodit 2 I imeSeriesValue 90 80 70 60 50 40 20 10 2 TimePeriodit 3. TimeSeries Value 90 80 60 50 40 30 10 TimePeriodit 4 TimeSeries Value 90 80 70 60 50 40 30 10 2 TimePeriod t -...
 Homework Consider the following time series data. Week Value a. Which of the following is a correct time series plot for this data? 1 18 2 14 3 17 4 12 5 17 6 15 TimeSeries Value 115 Week TimeSeries Value 3 4 5 Week 2 TimeSeries Value 15 3 4 . 5 Week plot #1 What type of pattern exists in the data? Horizontal a Search this course mework Week plot 01 What type of pattern exists in the...
 Consider the following time series data.
Quarter
Year 1
Year 2
Year 3
1
3
6
8
2
2
4
8
3
4
7
9
4
6
9
11
(a)
Choose the correct time series plot.
(i)
(ii)
(iii)
(iv)
- Select your answer -Plot (i)Plot (ii)Plot (iii)Plot (iv)Item
1
What type of pattern exists in the data?
- Select your answer -Positive trend pattern, no
seasonalityHorizontal pattern, no seasonalityNegative trend
pattern, no seasonalityPositive...
Consider the following time series data.
Consider the following time series data.
Quarter
Year 1
Year 2
Year 3
1
3
6
8
2
2
4
8
3
4
7
9
4
6
9
11
(a)
Choose the correct time series plot.
(i)
(ii)
(iii)
(iv)
- Select your answer -Plot (i)Plot (ii)Plot (iii)Plot (iv)Item
1
What type of pattern exists in the data?
- Select your answer -Positive trend pattern, no
seasonalityHorizontal pattern, no seasonalityNegative trend
pattern, no seasonalityPositive...
 NGAGE INDIAP HW Consider the following time series. 1 2 3 4 5 6 7 82 61 44 34 31 28 34 a. Which of the following is the correct time series plot? 2o TimeSeriesValue 20+ 107 Time Perioditi 90 TimeSeriesValue 80+ 707 NGAGE MINDTAP HW 90 I TimeSeriesValue 80+ 9 & 8 a Time Perioditi 901 TimeSeriesValue SAGE MINDTAP 90 TimeSeries Value $ 88@ $ $ 5 Time Perioditi 20 Timeberies Value MINDTAP Time periode Time Perioditi TimeSeriesValue %...
Most questions answered within 3 hours.
-
You have a 825.3 mL sample of 2.754 M HA (Ka =
4.49⋅10−4). Calculate the pH...
asked 1 hour ago -
The blues made its way into many kinds of music. Eric Clapton,
The Beatles, and Elvis...
asked 3 hours ago -
8. A wave in a string has a wave function given by: y (x, t) =...
asked 2 hours ago -
If you’re standing at the bottom of a hill and asked to evaluate
it while being...
asked 4 hours ago -
1. Which region has taken the lead in the world of
e-waste handling?
a) European Union...
asked 4 hours ago -
A 8.15- g bullet from a 9-mm pistol has a velocity of 366.0 m/s.
It strikes...
asked 5 hours ago -
The outstanding bonds of Alpha Extracts have a yield to maturity
of 7.4 percent and a...
asked 5 hours ago -
The Problem: The Case of the Harmonizing Vacations
Your CEO is exploring partnering with a European...
asked 6 hours ago -
A chemical equation is balanced by adding coefficients in front
of some formulas so that the...
asked 6 hours ago -
From the literature (reference your sources): What are the
lattice parameters of calcite and aragonite? Why...
asked 7 hours ago -
Your system is rejecting the question am asking which is
preceded by a case study. It...
asked 7 hours ago -
3. On January 2, 2000, Larry creates a trust with himself as
trustee. Larry as trustee...
asked 7 hours ago