
Homework Answers


Add Answer to:
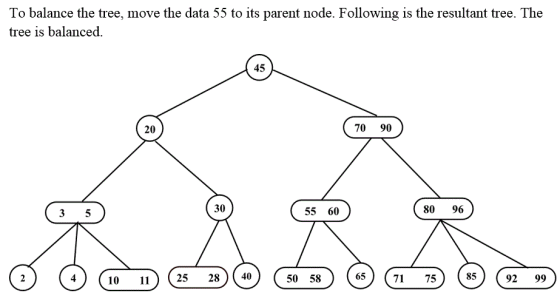
11. In the 2-3 tree given below (i.e., NOT a 2-3-4 tree), execute insert(28), insert(99), and...
Consider the below matrixA, which you can copy and paste directly into Matlab.
Problem #1: Consider the below matrix A, which you can copy and paste directly into Matlab. The matrix contains 3 columns. The first column consists of Test #1 marks, the second column is Test # 2 marks, and the third column is final exam marks for a large linear algebra course. Each row represents a particular student.A = [36 45 75 81 59 73 77 73 73 65 72 78 65 55 83 73 57 78 84 31 60 83...
6. For the B+-tree where M=3 and L=5 shown below, show how an insert of value...
6. For the B+-tree where M=3 and L=5 shown below, show how an insert of value 80 is handled. || 12 || 50 || / | \ / | \ 2 12 50 5 18 65 7 20 70 9 21 72 10 24 78 10 points 7. For the B+-tree where M=3 and L=5 shown below, show how an insert of value 28 is handled. || 24 || 75 || / | \ / | \ / | \...
1- Insert in the given order the following values into an intially empty 2-3-4 tree: 100,...
1- Insert in the given order the following values into an intially empty 2-3-4 tree: 100, 200, 300, 400, 500, 600, 700, 110, 120, 130, 800, 750, 690. Show how the tree evolves after each value is inserted. In other words, draw a picture of the tree after each insertion. 2- Insert the same sequence as above into an initially empty red-black tree. Again draw a picture of the tree after each insertion, and indicate which rotations and/or color flips...
Problems #3 thru #5 refer to the following b-tree. Note that problems #4 and #5 are...
 Problems #3 thru #5 refer to the following b-tree. Note that problems #4 and #5 are continuations of their previous problems. Original for 60 #3-5: 20,40 70 90 62 65 75 80 92 95 97 5 10 15 25 30 45 50 55 #3 Show the b-tree resulting by deleting 90. #4 Continuing from #3, show the b-tree resulting by deleting 25. Only attempt to borrow from an adjacent sibling. If possible, use the sibling that is immediately to its...
Data Structure!!!!!!!!!! For the B+-tree where M=3 and L=5 shown below, show how an insert of...
Data Structure!!!!!!!!!! For the B+-tree where M=3 and L=5 shown below, show how an insert of value 77 is handled. Use the method of splitting the node rather than redistributing between siblings. || 24 || 75 || / | \ / | \ / | \ || 10 || 16 || || 41 || 50 || || 84 || 90 || | / \ / | \ | \ \ / | | | | \ | | | 2...
For the B+-tree where M=3 and L=5 shown below, show how an insert of value 77...
For the B+-tree where M=3 and L=5 shown below, show how an insert of value 77 is handled. Use the method of splitting the node rather than redistributing between siblings. || 24 || 75 || / | \ / | \ / | \ || 10 || 16 || || 41 || 50 || || 84 || 90 || | / \ / | \ | \ \ / | | | | \ | | | 2 10 16...
A math test was given to five randomly selected schools. The result of the exams is...
A math test was given to five randomly selected schools. The result of the exams is given in the following table. School 1: 72 83 92 97 82 75 68 93 School 2: 75 81 95 92 88 70 70 90 97 84 76 School 3: 82 73 99 90 66 77 School 4: 71 85 91 95 89 73 70 96 92 83 71 58 63 89 School 5: 82 85 79 90 86 77 71 86 90 73...
1. Forecast demand for Year 4. a. Explain what technique you utilized to forecast your demand....
 1. Forecast demand for Year 4.
a. Explain what technique you utilized to forecast your
demand.
b. Explain why you chose this technique over others.
Year 3 Year 1 Year 2 Actual Actual Actual Forecast Forecast Forecast Demand Demand Demand Week 1 52 57 63 55 66 77 Week 2 49 58 68 69 75 65 Week 3 47 50 58 65 80 74 Week 4 60 53 58 55 78 67 57 Week 5 49 57 64 76 77...
1. Forecast demand for Year 4.
a. Explain what technique you utilized to forecast your
demand.
b. Explain why you chose this technique over others.
Year 3 Year 1 Year 2 Actual Actual Actual Forecast Forecast Forecast Demand Demand Demand Week 1 52 57 63 55 66 77 Week 2 49 58 68 69 75 65 Week 3 47 50 58 65 80 74 Week 4 60 53 58 55 78 67 57 Week 5 49 57 64 76 77...
Write a python nested for loop that prints out the following pattern 100 99 98 97...
Write a python nested for loop that prints out the following pattern 100 99 98 97 96 95 94 93 92 91 90 89 88 87 86 85 84 83 82 81 80 79 78 77 76 75 74 73 72 71 70 69 68 67 66 65 64 63 62 61 60 59 58 57 56 55 54 53 52 51 50 49 48 47 46 45 44 43 42 41 40 39 38 37 36 35 34 33...
RANGES FREQUENCY RELATIVE FREQUENCY CUMULATIVE REL. FREQ. 1 - 10 11 - 20 21 - 30 31 - 40...
 RANGES
FREQUENCY
RELATIVE FREQUENCY
CUMULATIVE REL. FREQ.
1 - 10
11 - 20
21 - 30
31 - 40
41 - 50
51 - 60
61 - 70
71 - 80
81 - 90
91 - 100
'= 100 DATA
VALUES??
SO, WHAT DOES A FREQUENCY TABLE TELL US?
If
you wrote each of the above data values on a ping pong ball,, put
them in a jar and blindly pulled one out:
What is the probability that this ball...
RANGES
FREQUENCY
RELATIVE FREQUENCY
CUMULATIVE REL. FREQ.
1 - 10
11 - 20
21 - 30
31 - 40
41 - 50
51 - 60
61 - 70
71 - 80
81 - 90
91 - 100
'= 100 DATA
VALUES??
SO, WHAT DOES A FREQUENCY TABLE TELL US?
If
you wrote each of the above data values on a ping pong ball,, put
them in a jar and blindly pulled one out:
What is the probability that this ball...
 Problems #3 thru #5 refer to the following b-tree. Note that problems #4 and #5 are continuations of their previous problems. Original for 60 #3-5: 20,40 70 90 62 65 75 80 92 95 97 5 10 15 25 30 45 50 55 #3 Show the b-tree resulting by deleting 90. #4 Continuing from #3, show the b-tree resulting by deleting 25. Only attempt to borrow from an adjacent sibling. If possible, use the sibling that is immediately to its...
 1. Forecast demand for Year 4.
a. Explain what technique you utilized to forecast your
demand.
b. Explain why you chose this technique over others.
Year 3 Year 1 Year 2 Actual Actual Actual Forecast Forecast Forecast Demand Demand Demand Week 1 52 57 63 55 66 77 Week 2 49 58 68 69 75 65 Week 3 47 50 58 65 80 74 Week 4 60 53 58 55 78 67 57 Week 5 49 57 64 76 77...
1. Forecast demand for Year 4.
a. Explain what technique you utilized to forecast your
demand.
b. Explain why you chose this technique over others.
Year 3 Year 1 Year 2 Actual Actual Actual Forecast Forecast Forecast Demand Demand Demand Week 1 52 57 63 55 66 77 Week 2 49 58 68 69 75 65 Week 3 47 50 58 65 80 74 Week 4 60 53 58 55 78 67 57 Week 5 49 57 64 76 77...
 RANGES
FREQUENCY
RELATIVE FREQUENCY
CUMULATIVE REL. FREQ.
1 - 10
11 - 20
21 - 30
31 - 40
41 - 50
51 - 60
61 - 70
71 - 80
81 - 90
91 - 100
'= 100 DATA
VALUES??
SO, WHAT DOES A FREQUENCY TABLE TELL US?
If
you wrote each of the above data values on a ping pong ball,, put
them in a jar and blindly pulled one out:
What is the probability that this ball...
RANGES
FREQUENCY
RELATIVE FREQUENCY
CUMULATIVE REL. FREQ.
1 - 10
11 - 20
21 - 30
31 - 40
41 - 50
51 - 60
61 - 70
71 - 80
81 - 90
91 - 100
'= 100 DATA
VALUES??
SO, WHAT DOES A FREQUENCY TABLE TELL US?
If
you wrote each of the above data values on a ping pong ball,, put
them in a jar and blindly pulled one out:
What is the probability that this ball...
Most questions answered within 3 hours.
-
Cars enter a car wash at a mean rate of 2 cars per half an hour....
asked 16 seconds ago -
Your eye is 2.5 m away from a 60W light bulb that emits light in
all...
asked 3 minutes ago -
As a human and using your own human Intelligent Analysis (IA),
you would have noted that...
asked 5 minutes ago -
Transverse waves on a string have wave speed 8 m/s, amplitude
0.071 m, and wavelength 0.33...
asked 19 minutes ago -
Write SQL queries to answer the following question: A. Which
students are enrolled in Database and...
asked 13 minutes ago -
At −11°C a sample of carbon monoxide gas exerts a pressure of
0.45 atm. What is...
asked 19 minutes ago -
Aqueous hydrobromic acid HBr reacts with solid sodium hydroxide
NaOH to produce aqueous sodium bromide NaBr...
asked 33 minutes ago -
You dissolve 1.0 mole of a substance in water to a total volume
of 1,000 ml....
asked 37 minutes ago -
A company's total assets at the end of last year were 500,000
and its EBIT was...
asked 43 minutes ago -
Is it redundant to say that a pure substance is homogeneous, or
can it not be...
asked 46 minutes ago -
Already famous by the time he arrived at Princeton University in
1933, Einstein had suggested a...
asked 1 hour ago -
Suppose the average male brain weight (in grams) is estimated to
be 13201320 grams. A 1905...
asked 1 hour ago