

Homework Answers
Add Answer to:
3. If you get the H1N1 Flu vaccine, not only are your chances of getting sick...
5) (28 points) Suppose the demand and supply for flu shots are given by pd =...
 5) (28 points) Suppose the demand and supply for flu shots are given by pd = 1200-Q ps = 440 + Q Suppose flu shots generate a positive externality, and the marginal external benefit (MEB) is MEB=60 -0.050. (a) Derive the marginal social benefit (MSB) curve. (b) Draw the Demand, Supply, and MSB curves on the same graph (with P on the vertical axis and Q on the horizontal axis) and clearly indicate the curves in your graph. (c) Calculate...
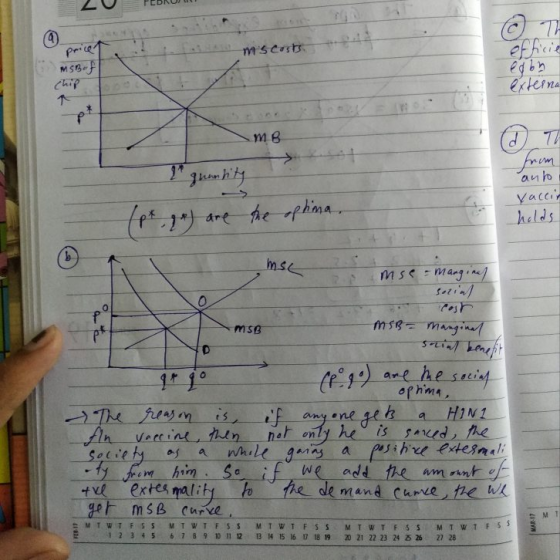
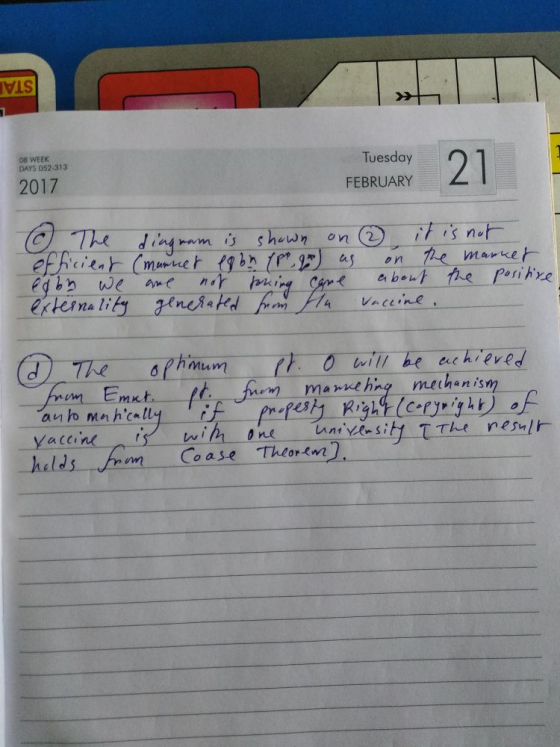
4. When a person receives a flu shot, other people benefit since the risk of catching...
 4. When a person receives a flu shot, other people benefit since the risk of catching the flu from the shot recipient is reduced. (a) Graph the supply and demand for flu shots, indicating both the private and the social marginal benefit. Label the equilibrium price and quantity and the socially optimal quantity of flu shots. (b) What policy would you recommend to lead to the socially optimal quantity of flu shots? Explain your answer.
5. Suppose the demand for flu shots can be described by the inverse function P=80-Q and...
 5. Suppose the demand for flu shots can be described by the inverse function P=80-Q and the inverse supply curve is given as P=8+2Q. What is the market equilibrium price and quantity in this market? Suppose that flu shots generate consumption externalities such that the marginal social benefit is given by the equation MSB=80 - 12Q. What are the values of Price and Quantity that maximize social welfare/surplus? Is there over- or under consumption of flu shots? What is the...
1. For each of the following situations draw the Demand and Supply for a competitive market....
 1. For each of the following situations draw the Demand and Supply for a competitive market. Show the Social Marginal Benefit and Social Marginal Cost curves and explain whether the presence of the externality leads to a competitive market equilibrium with too much or too little production relative to the socially optimal outcome. (a) A negative externality associated with production. (b) A negative externality associated with consumption (c) A positive externality associated with consumption. 2. Consider a downward-sloping market demand...
Some people claim the flu vaccine makes them get sick with the flu. What could you...
Some people claim the flu vaccine makes them get sick with the flu. What could you tell them about why that is not true?
3) Assume that the market for energy efficient window installations in San Diego is perfectly competitive. Quarterly inverse supply and inverse demand are: P 1200 3Q (Private MB) P 440Qs (Private...
 3) Assume that the market for energy efficient window installations in San Diego is perfectly competitive. Quarterly inverse supply and inverse demand are: P 1200 3Q (Private MB) P 440Qs (Private MC) neighbors (lowering the overall price of electricity, reducing pollution, and so on) These external benefits to consumers are estimated to be EMB 2Q (the more windows installed, the more external benefit to installing more windows). a) Find the equilibrium price and quantity that will be produced in a...
I need parts D, E, F only! 1. Consider a firm that manufactures dyed textiles. The...
 I need parts D, E, F only!
1. Consider a firm that manufactures dyed textiles. The firm incurs a marginal cost of MC 2Q Suppose that for every textile produced, there is an externality cost of 12 (from dyes being leaked into the water). So the true social marginal cost of widget production is MC = 2Q+12. Imagine that the (a) Assuming this is a perfectly competitive market, write out the equation for the firm's supply (b) Calculate the equilibrium...
I need parts D, E, F only!
1. Consider a firm that manufactures dyed textiles. The firm incurs a marginal cost of MC 2Q Suppose that for every textile produced, there is an externality cost of 12 (from dyes being leaked into the water). So the true social marginal cost of widget production is MC = 2Q+12. Imagine that the (a) Assuming this is a perfectly competitive market, write out the equation for the firm's supply (b) Calculate the equilibrium...
3. The demand in a market is Q (P) 150-3P. The supply in the market is...
 3. The demand in a market is Q (P) 150-3P. The supply in the market is QS(P)- 3P- 30 (a) Find the competitive equilibrium in the market (P*, Q*) (b) Determine the levels of Consumer, Producer and Total Surplus in the competitive equilibrium (c) Consumption of the good leads to a negative externality. The external marginal benefit function is mbeQw . Draw a graph that shows the Demand, Supply and the Social Marginal Benefits. where measures units consumed in the...
Which of the following statements are true regarding externalities? (Check all thot apply.) OA. In the...
 Which of the following statements are true regarding externalities? (Check all thot apply.) OA. In the case of an extemality, the free market wil maximize social surplus. occurs when an economic activity has a spillover cost to a bystander. C. Deadweight loss can be either a foregone benefit or the total cost of the externality to society. D. For compuing efficient outcomes, economic agente adjust the demand curve to account for negative extenalities In the case of the negative extemality,the...
Question 1: For this question, ignore any externalities that might be associated with the production of...
Question 1: For this question, ignore any externalities that might be associated with the production of honey. Graphically indicate the demand (D0) and Supply (S0) and the equilibrium in the market for honey. Show the equilibrium price and quantity, Q0 and P0. Indicate on your graph the areas of consumer surplus and producer surplus. What is the output level the Benevolent Dictator would like to see in this market? Why? Question 2: Now suppose that scientists have discovered that the...
 5) (28 points) Suppose the demand and supply for flu shots are given by pd = 1200-Q ps = 440 + Q Suppose flu shots generate a positive externality, and the marginal external benefit (MEB) is MEB=60 -0.050. (a) Derive the marginal social benefit (MSB) curve. (b) Draw the Demand, Supply, and MSB curves on the same graph (with P on the vertical axis and Q on the horizontal axis) and clearly indicate the curves in your graph. (c) Calculate...
 4. When a person receives a flu shot, other people benefit since the risk of catching the flu from the shot recipient is reduced. (a) Graph the supply and demand for flu shots, indicating both the private and the social marginal benefit. Label the equilibrium price and quantity and the socially optimal quantity of flu shots. (b) What policy would you recommend to lead to the socially optimal quantity of flu shots? Explain your answer.
 5. Suppose the demand for flu shots can be described by the inverse function P=80-Q and the inverse supply curve is given as P=8+2Q. What is the market equilibrium price and quantity in this market? Suppose that flu shots generate consumption externalities such that the marginal social benefit is given by the equation MSB=80 - 12Q. What are the values of Price and Quantity that maximize social welfare/surplus? Is there over- or under consumption of flu shots? What is the...
 1. For each of the following situations draw the Demand and Supply for a competitive market. Show the Social Marginal Benefit and Social Marginal Cost curves and explain whether the presence of the externality leads to a competitive market equilibrium with too much or too little production relative to the socially optimal outcome. (a) A negative externality associated with production. (b) A negative externality associated with consumption (c) A positive externality associated with consumption. 2. Consider a downward-sloping market demand...
 3) Assume that the market for energy efficient window installations in San Diego is perfectly competitive. Quarterly inverse supply and inverse demand are: P 1200 3Q (Private MB) P 440Qs (Private MC) neighbors (lowering the overall price of electricity, reducing pollution, and so on) These external benefits to consumers are estimated to be EMB 2Q (the more windows installed, the more external benefit to installing more windows). a) Find the equilibrium price and quantity that will be produced in a...
 I need parts D, E, F only!
1. Consider a firm that manufactures dyed textiles. The firm incurs a marginal cost of MC 2Q Suppose that for every textile produced, there is an externality cost of 12 (from dyes being leaked into the water). So the true social marginal cost of widget production is MC = 2Q+12. Imagine that the (a) Assuming this is a perfectly competitive market, write out the equation for the firm's supply (b) Calculate the equilibrium...
I need parts D, E, F only!
1. Consider a firm that manufactures dyed textiles. The firm incurs a marginal cost of MC 2Q Suppose that for every textile produced, there is an externality cost of 12 (from dyes being leaked into the water). So the true social marginal cost of widget production is MC = 2Q+12. Imagine that the (a) Assuming this is a perfectly competitive market, write out the equation for the firm's supply (b) Calculate the equilibrium...
 3. The demand in a market is Q (P) 150-3P. The supply in the market is QS(P)- 3P- 30 (a) Find the competitive equilibrium in the market (P*, Q*) (b) Determine the levels of Consumer, Producer and Total Surplus in the competitive equilibrium (c) Consumption of the good leads to a negative externality. The external marginal benefit function is mbeQw . Draw a graph that shows the Demand, Supply and the Social Marginal Benefits. where measures units consumed in the...
 Which of the following statements are true regarding externalities? (Check all thot apply.) OA. In the case of an extemality, the free market wil maximize social surplus. occurs when an economic activity has a spillover cost to a bystander. C. Deadweight loss can be either a foregone benefit or the total cost of the externality to society. D. For compuing efficient outcomes, economic agente adjust the demand curve to account for negative extenalities In the case of the negative extemality,the...
Most questions answered within 3 hours.
-
The following results were obtained as
part of a multiple regression analysis involving 3 independent
variables:...
asked 9 minutes ago -
The time to complete a standardized exam is approximately normal
with a mean of 70 minutes...
asked 2 hours ago -
Two thousand randomly selected adults were asked whether or not
they have ever shopped on the...
asked 2 hours ago -
Estimate the diffusion coefficient for methyl phenyl sulfide in
water at 25 degrees Celcius.
asked 1 hour ago -
10.g of a certain metal absorb 40. cal of heat and the temperature
is abserved to...
asked 2 hours ago -
How many milliliters of 0.0695 M Ca( OH)
2would be required to exactly neutralize 176 mL...
asked 2 hours ago -
A telephone survey uses a random digit dialing machine to call
subjects. The random digit dialing...
asked 3 hours ago -
How can having too little or too much of a certain
protein cause problems for an...
asked 4 hours ago -
Assume a muscle has a PCSA = 20 cm2 and Lo = 12 cm. Assume it...
asked 6 hours ago -
What is the yield to maturity of a ten-year, $1,000 bond with a
5.2% coupon rate...
asked 7 hours ago -
A mass m = 5 kg is tied on one end of a rope and is...
asked 7 hours ago -
The Average sales price of single-family houses in Charlotte is
$210,000 with a standard deviation of...
asked 7 hours ago