Financial Accounting
![]() Screen Shot 2020-07-14 at 11.11.08 AM.png
Screen Shot 2020-07-14 at 11.11.08 AM.png
![]() Screen Shot 2020-07-14 at 11.11.20 AM.png
Screen Shot 2020-07-14 at 11.11.20 AM.png
![]() Screen Shot 2020-07-14 at 11.10.52 AM.png
Screen Shot 2020-07-14 at 11.10.52 AM.png
![]() Screen Shot 2020-07-14 at 11.11.28 AM.png
Screen Shot 2020-07-14 at 11.11.28 AM.png
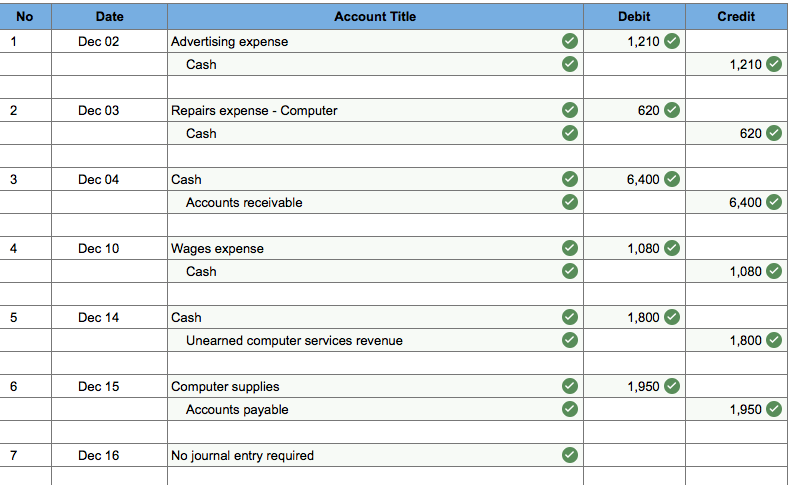
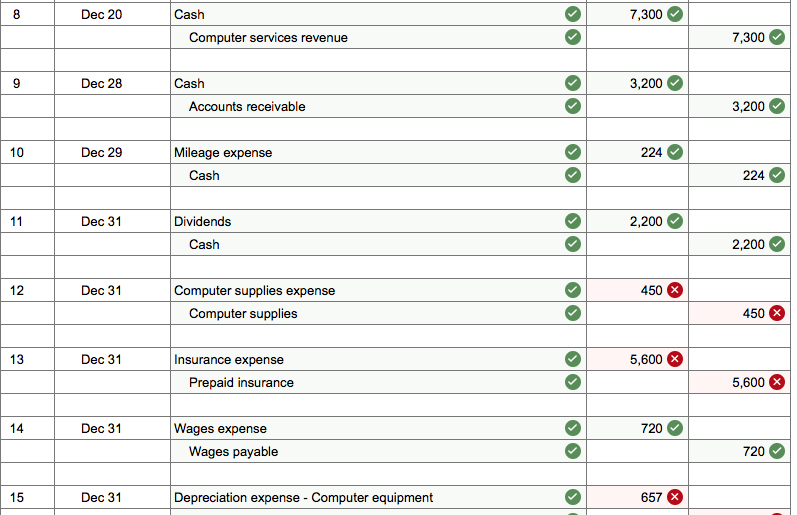
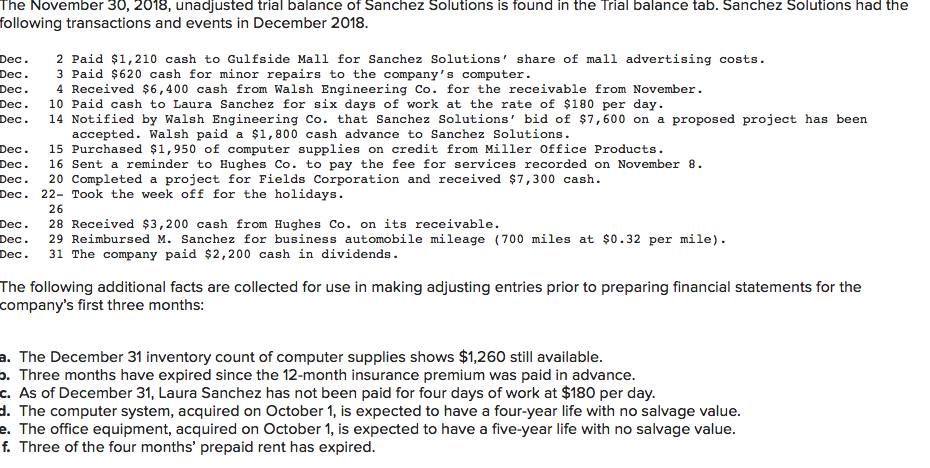
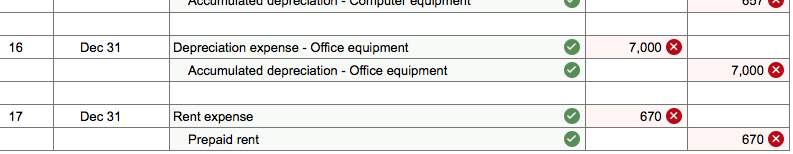
I don't know how to complete the entries for Dec 31.
Homework Answers
Request Answer!
We need at least 10 more requests to produce the answer.
0 / 10 have requested this problem solution
The more requests, the faster the answer.
The following information is available for the preparation of the government-wide financial statements for the City of Southern Springs as of April 30, 2020:
 Screen Shot 2020-08-24 at 10.42.22 AM.pngScreen Shot 2020-08-24 at 10.41.59 AM.png
Concord Company has four operating divisions. During the first quarter of 2017
Screen Shot 2020-04-10 at 8.50.05 AM.pngScreen Shot 2020-04-10 at 8.49.58 AM.pngScreen Shot 2020-04-10 at 8.50.19 AM.pngScreen Shot 2020-04-10 at 8.48.58 AM.png
Accounting for uncollectible accounts using the allowance method (aging-of-receivables) and reporting receivables on the balance sheet
Screen Shot 2020-07-25 at 10.57.17 PM.pngScreen Shot 2020-07-25 at 10.56.58 PM.pngScreen Shot 2020-07-25 at 10.57.09 PM.pngScreen Shot 2020-07-25 at 10.56.48 PM.pngScreen Shot 2020-07-25 at 10.56.30 PM.png
3 grams of musk oil are required for each bottle of Mink Caress, a very popular
Screen Shot 2020-10-28 at 10.38.15 AM.pngScreen Shot 2020-10-28 at 10.38.03 AM.pngThree grams of musk oil are required for each bottle of Mink Caress, a very popular perfume made by a small company in western Siberia. The cost of the musk oil is $2.10 per gram.
DC Motor Position Control System
The figure 1 and 2 below show, respectively, components and block diagram of a motor and the measurements of velocity (via the tacho unit) and position (via the potentiometer). n represents the gearbox ratio between the rotating shaft and the output shaft. The left-hand side of the diagram represents the controller. A reference set point for the rotating shaft is entered in degrees and this is converted to an equivalent voltage. The error is calculated by subtracting the measured position from the...
Classify the molecules below as aromatic, anti-aromatic, or non-aromatic.
Screen Shot 2020-03-25 at 11.05.30 AM.png
CH. 06 Q 8.1
Screen Shot 2020-10-13 at 9.29.45 AM.png
3. Market Equilibrium and Disequilibrium
The following graph shows the monthly demand and supply curves in the market for keyboards. Use the graph input tool to help you answer the following questions. You will not be graded on any changes you make to this graph. Note: Once you enter a value in a white field, the graph and any corresponding amounts in each grey field will change accordingly. The equilibrium price in this market is per keyboard, and the equilibrium quantity is keyboards bought and sold...
math problem
Screen Shot 2020-07-31 at 12.38.37 PM.png
Most questions answered within 3 hours.
-
Assume that the readings at freezing on a batch of thermometers
are normally distributed with a...
asked 55 seconds ago -
MENSA Int'l just paid a dividend of $1.25. Their growth rate in
dividends is 10% and...
asked 14 seconds from now -
4. The excitation of a 414 V, 3-phase, delta-connected
synchronous motor is such that that the...
asked 16 minutes ago -
3. (20 pts) In the Carnot engine (refer to the figure in
question 2), an ideal...
asked 23 minutes ago -
A contestant is facing 10 closed doors. Behind one of these
doors there is a prize....
asked 25 minutes ago -
Showing appropriate work and equations, what is the yield to
maturity on a share of Six...
asked 40 minutes ago -
what would be the best entry mode in shipping from the U.S to Spain
by boat...
asked 44 minutes ago -
Under certain conditions, the substance ammonium
nitrate can be broken down to form dinitrogen
monoxide and...
asked 46 minutes ago -
1. A boy stands on one end of a boat, and then walks to the
other...
asked 56 minutes ago -
Casey is on trial under criminal allegations that she engaged in
fraudulent behavior at the company...
asked 1 hour ago -
Surplus Styles is a manufacturer of hair care products,
including shampoos, conditioners, and hair gels. The...
asked 59 minutes ago -
Using an income-expenditure diagram, use the infinite line and
double-drop line tools to show the economy...
asked 1 hour ago