
Homework Answers
![12-609 881 5-90 - toring and ope) = -90 - [188 - Toni (.507] Lulja) = -98-189 + 42.90 P.M = 180+ Laywon lw=wige rispe = 10x +](http://img.homeworklib.com/questions/d3667dd0-ca7a-11ea-aead-a92059adcd61.png?x-oss-process=image/resize,w_560)
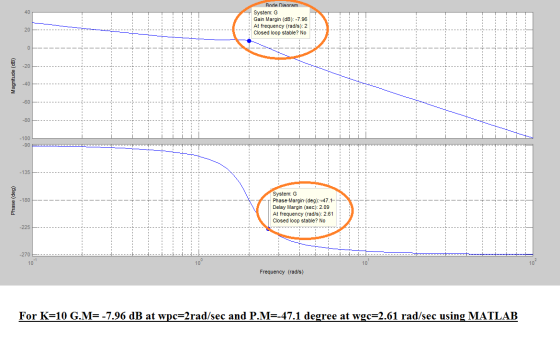
![MATLAB CODE clc clear all close all syms s K=10 G=tf([O O O K],[1 1 4 0]) % Defining the open loop transfer function bode (G)](http://img.homeworklib.com/questions/d54b6670-ca7a-11ea-9718-fd36d4e20361.png?x-oss-process=image/resize,w_560)
Add Answer to:
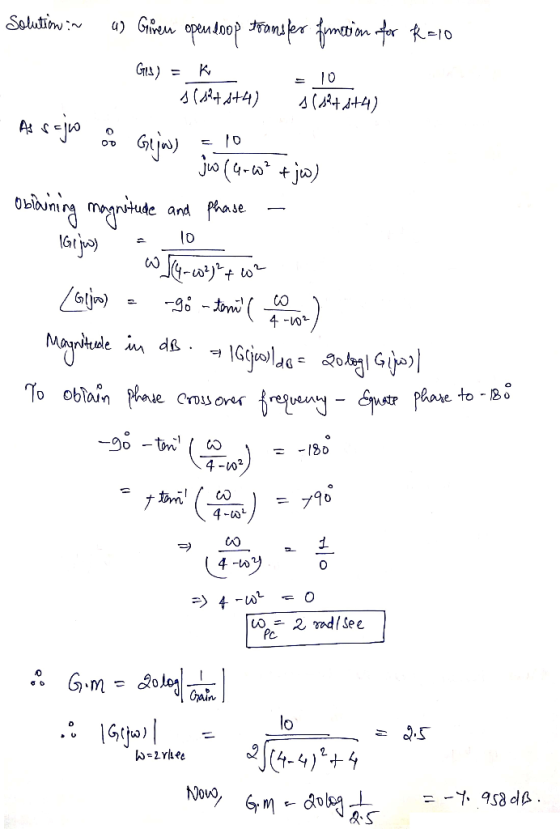
Figure 1 Problem 3 For the system shown in the above figure, where G(s) a) Draw...
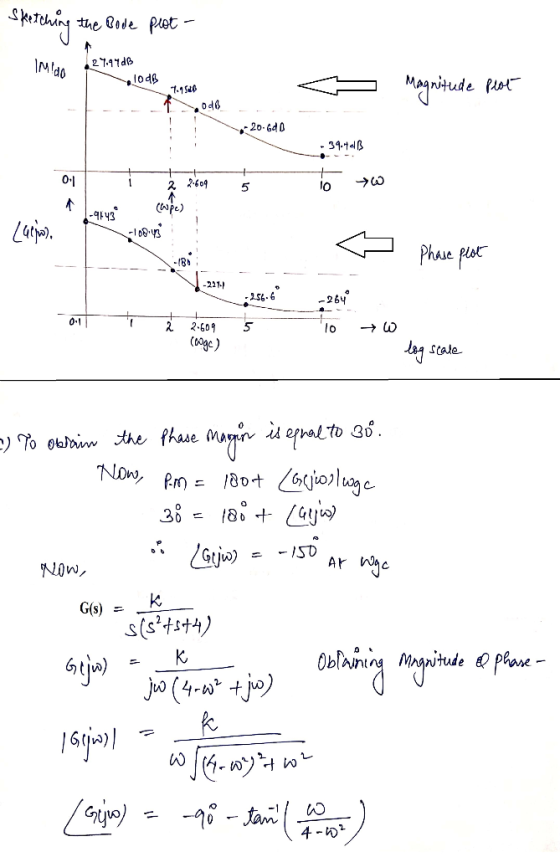
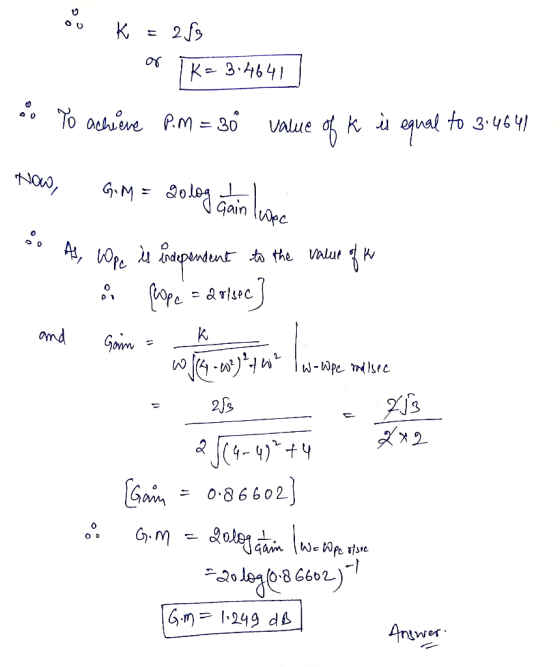
Consider the system shown as below. Draw a Bode diagram of the open-loop transfer function G(s).
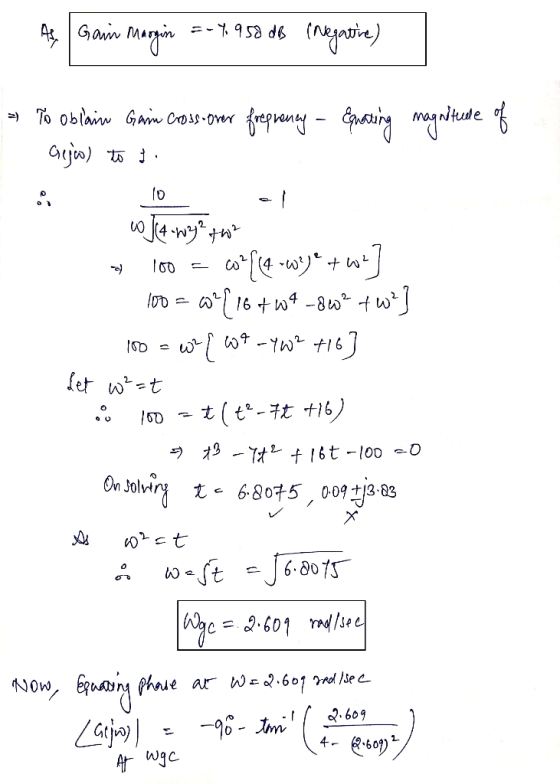
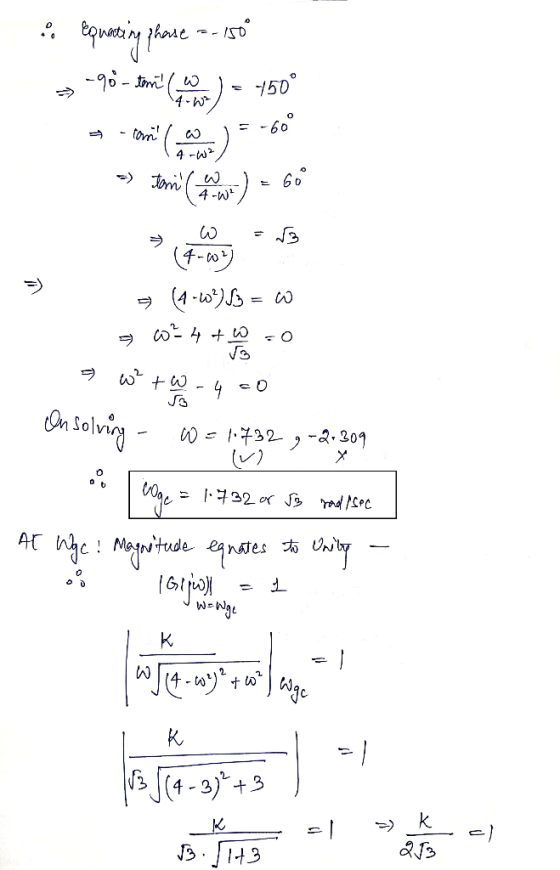
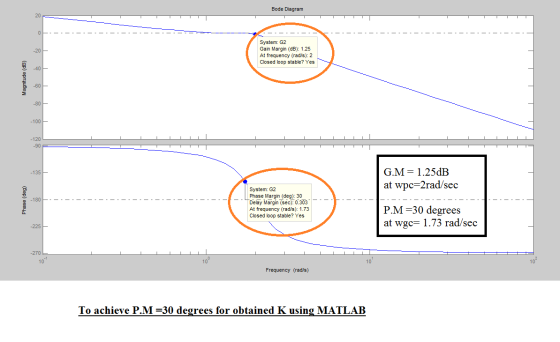
 1 Consider the system shown as below. Draw a Bode diagram of the open-loop transfer function G(s). Determine the phase margin, gain-crossover frequency, gain margin and phase-crossover frequency, (Sketch the bode diagram by hand) 2 Consider the system shown as below. Use MATLAB to draw a bode diagram of the open-loop transfer function G(s). Show the gain-crossover frequency and phase-crossover frequency in the Bode diagram and determine the phase margin and gain margin. 3. Consider the system shown as below. Design a...
Consider the following unity feedback system for Problems 2-3 R(9) —tqKAG YIS) Figure 1 Problem 2...
 Consider the following unity feedback system for Problems 2-3 R(9) —tqKAG YIS) Figure 1 Problem 2 Consider the system shown in the above figure, where G(s) = s(8+1128+1) a) Draw a Bode diagram of the open-loop transfer function G(s) when K=1. b) On your plot, indicate the crossover frequencies, PM, and GM. Is the closed-loop system stable with K=1? c) Determine the range of K for which the closed-loop systems will be stable. d) Verify your answer in (c) using...
For the unity feedback system in the below figure, 1. EGO) R(s)) C(s) G(s)K (s 1) (s + 4) a) Sket...
 For the unity feedback system in the below figure, 1. EGO) R(s)) C(s) G(s)K (s 1) (s + 4) a) Sketch the bode plot with Matlab command bode0 b) Plot the nyquist diagram using Matlab command nyquist(0, find the system stability c) Find phase margin, gain margin, and crossover frequencies using Matlab command margin(0 and find the system stability
For the unity feedback system in the below figure, 1. EGO) R(s)) C(s) G(s)K (s 1) (s + 4) a) Sketch...
For the unity feedback system in the below figure, 1. EGO) R(s)) C(s) G(s)K (s 1) (s + 4) a) Sketch the bode plot with Matlab command bode0 b) Plot the nyquist diagram using Matlab command nyquist(0, find the system stability c) Find phase margin, gain margin, and crossover frequencies using Matlab command margin(0 and find the system stability
For the unity feedback system in the below figure, 1. EGO) R(s)) C(s) G(s)K (s 1) (s + 4) a) Sketch...
1) (10 pts) Consider the unity feedback system shown in the figure: For each of the...
 1) (10 pts) Consider the unity feedback system shown in the figure: For each of the following transfer function G(s), plot its Bode plots using Matlab command "bode", and then work on the plots to find out the crossover frequency phase margin . the phase crossover frequency and the gain margin GM: (a) G(s)= , the S+4 s(s + l)(s + 2)(s +10) (b) Gs)100
Spring 2019 3. Given a closed-loop control system with unity feedback is shown in the block...
 Spring 2019 3. Given a closed-loop control system with unity feedback is shown in the block diagram. G(s) is the open-loop transfer function, and the controller is a gain, K. 1. (20) Calculate the open-loop transfer function tar →Q--t G(s) (10) Calculate the steady-state error to a step input of the open-loop system. 7. (in Bode Form) from the Bode plot. (10) Calculate the shortest possible settling time with a percentage overshoot of 5% or less. 8. 2. (10)Plot the...
3. Construct the bode plot on a semilog Graph-paper for a unity feedback system whose open...
 Construct the bode plot on a semilog Graph-paper for a unity feedback system whose open looptransfer function is given by \(G(S)=\frac{100}{S(S+1)(2+S)} .\) From the bode plot determinea) Gain and phase crossover frequencies.b) Gain and Phase margin, andc) Stability of the closed loop system
Please show all work and answer all the questions so I can learn how to do it on my own. Thank yo...
 Please show all work and answer all the questions so I can learn
how to do it on my own. Thank you in advance.
(GM,PM,wcg,wepl-margin(sys) computes the gain margin GM, the phase margin PM, and the associated frequencies weg and wep. They can also be read from the Bode plot. G(s) R(s) EX G(s)- (s +10(s+1)2 Questions Draw the Bode plot when K-1, find the gain margin, and determine the closed-loop stability. (b) Convert the gain margin to a normal...
Please show all work and answer all the questions so I can learn
how to do it on my own. Thank you in advance.
(GM,PM,wcg,wepl-margin(sys) computes the gain margin GM, the phase margin PM, and the associated frequencies weg and wep. They can also be read from the Bode plot. G(s) R(s) EX G(s)- (s +10(s+1)2 Questions Draw the Bode plot when K-1, find the gain margin, and determine the closed-loop stability. (b) Convert the gain margin to a normal...
Consider the unity-feedback system shown below: R(s) E(s) input: r(t), output: y(t) C(s) P(s) error: e()...
 Consider the unity-feedback system shown below: R(s) E(s) input: r(t), output: y(t) C(s) P(s) error: e() r(t) y(t) closed-loop transfer-function: Hyr(sD t the closed-loop transfer-function be Hyr(s) Y (s) R(s) Let the transfer-function of the plant be P(s) 10 s (s 1) (s 5) The open-loop transfer-function is G(s) P(s) C(s) DESIGN OBJECTIVES: Find a controller C(s) such that the following are satisfied i) The closed-loop system is stable. ii) The steady-state error ess due to a unit-ramp input r(t)...
Nise Ch. 10, Problem 10.(**Ignore book question**) Here is is the questions for each system, (a) ...
 Nise Ch. 10, Problem 10.(**Ignore book question**) Here is is the questions for each system, (a) Use MATLAB to draw/plot the root locus (b) Obtain the limits for stable gain. (c) Get bode plot (d) Get gain margin and limits for stable K/gain. (It should be the same as the values obtained from the locus) -Suggestion ) Use the commands like 'rlocus, riocfind' and 'bode, in Matlab. C(s) R(s)+ | (s + 2) -ㄒㄧ System I R(s) + C(s) (s...
Problem 3. For the above feedback system, the bode diagram of the stable open-loop transfer function...
 Problem 3. For the above feedback system, the bode diagram of the stable open-loop transfer function G(s) is plotted below: (a) Find the approximate gain margin and phase margin of the system? Is the closed-loop system stable? (b) Suppose in the closed-loop system (s) is replaced with KG(8). What is the range of K so that the closed-loop system is stable? (C) Determine the system type of G(s). (d) Estimate the steady-state errors of the closed-loop system for tracking the...
 Consider the following unity feedback system for Problems 2-3 R(9) —tqKAG YIS) Figure 1 Problem 2 Consider the system shown in the above figure, where G(s) = s(8+1128+1) a) Draw a Bode diagram of the open-loop transfer function G(s) when K=1. b) On your plot, indicate the crossover frequencies, PM, and GM. Is the closed-loop system stable with K=1? c) Determine the range of K for which the closed-loop systems will be stable. d) Verify your answer in (c) using...
 For the unity feedback system in the below figure, 1. EGO) R(s)) C(s) G(s)K (s 1) (s + 4) a) Sketch the bode plot with Matlab command bode0 b) Plot the nyquist diagram using Matlab command nyquist(0, find the system stability c) Find phase margin, gain margin, and crossover frequencies using Matlab command margin(0 and find the system stability
For the unity feedback system in the below figure, 1. EGO) R(s)) C(s) G(s)K (s 1) (s + 4) a) Sketch...
For the unity feedback system in the below figure, 1. EGO) R(s)) C(s) G(s)K (s 1) (s + 4) a) Sketch the bode plot with Matlab command bode0 b) Plot the nyquist diagram using Matlab command nyquist(0, find the system stability c) Find phase margin, gain margin, and crossover frequencies using Matlab command margin(0 and find the system stability
For the unity feedback system in the below figure, 1. EGO) R(s)) C(s) G(s)K (s 1) (s + 4) a) Sketch...
 1) (10 pts) Consider the unity feedback system shown in the figure: For each of the following transfer function G(s), plot its Bode plots using Matlab command "bode", and then work on the plots to find out the crossover frequency phase margin . the phase crossover frequency and the gain margin GM: (a) G(s)= , the S+4 s(s + l)(s + 2)(s +10) (b) Gs)100
 Spring 2019 3. Given a closed-loop control system with unity feedback is shown in the block diagram. G(s) is the open-loop transfer function, and the controller is a gain, K. 1. (20) Calculate the open-loop transfer function tar →Q--t G(s) (10) Calculate the steady-state error to a step input of the open-loop system. 7. (in Bode Form) from the Bode plot. (10) Calculate the shortest possible settling time with a percentage overshoot of 5% or less. 8. 2. (10)Plot the...
 Construct the bode plot on a semilog Graph-paper for a unity feedback system whose open looptransfer function is given by \(G(S)=\frac{100}{S(S+1)(2+S)} .\) From the bode plot determinea) Gain and phase crossover frequencies.b) Gain and Phase margin, andc) Stability of the closed loop system
 Please show all work and answer all the questions so I can learn
how to do it on my own. Thank you in advance.
(GM,PM,wcg,wepl-margin(sys) computes the gain margin GM, the phase margin PM, and the associated frequencies weg and wep. They can also be read from the Bode plot. G(s) R(s) EX G(s)- (s +10(s+1)2 Questions Draw the Bode plot when K-1, find the gain margin, and determine the closed-loop stability. (b) Convert the gain margin to a normal...
Please show all work and answer all the questions so I can learn
how to do it on my own. Thank you in advance.
(GM,PM,wcg,wepl-margin(sys) computes the gain margin GM, the phase margin PM, and the associated frequencies weg and wep. They can also be read from the Bode plot. G(s) R(s) EX G(s)- (s +10(s+1)2 Questions Draw the Bode plot when K-1, find the gain margin, and determine the closed-loop stability. (b) Convert the gain margin to a normal...
 Consider the unity-feedback system shown below: R(s) E(s) input: r(t), output: y(t) C(s) P(s) error: e() r(t) y(t) closed-loop transfer-function: Hyr(sD t the closed-loop transfer-function be Hyr(s) Y (s) R(s) Let the transfer-function of the plant be P(s) 10 s (s 1) (s 5) The open-loop transfer-function is G(s) P(s) C(s) DESIGN OBJECTIVES: Find a controller C(s) such that the following are satisfied i) The closed-loop system is stable. ii) The steady-state error ess due to a unit-ramp input r(t)...
 Nise Ch. 10, Problem 10.(**Ignore book question**) Here is is the questions for each system, (a) Use MATLAB to draw/plot the root locus (b) Obtain the limits for stable gain. (c) Get bode plot (d) Get gain margin and limits for stable K/gain. (It should be the same as the values obtained from the locus) -Suggestion ) Use the commands like 'rlocus, riocfind' and 'bode, in Matlab. C(s) R(s)+ | (s + 2) -ㄒㄧ System I R(s) + C(s) (s...
 Problem 3. For the above feedback system, the bode diagram of the stable open-loop transfer function G(s) is plotted below: (a) Find the approximate gain margin and phase margin of the system? Is the closed-loop system stable? (b) Suppose in the closed-loop system (s) is replaced with KG(8). What is the range of K so that the closed-loop system is stable? (C) Determine the system type of G(s). (d) Estimate the steady-state errors of the closed-loop system for tracking the...
Most questions answered within 3 hours.
-
MATLAB HW 11 problem using Switch Case and Input commands
Write a script file that calculates...
asked 15 minutes ago -
A college student is employed as a door-to-door newspaper
salesman. Historical data suggests that the student...
asked 30 minutes ago -
Considering gravitational time dilation, calculate the time that
passes in Earth’s surface while 1 hour passes...
asked 54 minutes ago -
Minitab Problem: Take the Lake Hume June rainfall data and find
use the processes outlined in...
asked 1 hour ago -
X Company is trying to decide whether to continue using old
equipment to make Product A...
asked 1 hour ago -
IN PYTHON ONLY !! Program 2: Re-work
program #5 (WeeklyHours) from the previous assignment such that...
asked 2 hours ago -
The average length of time between arrivals at a turnpike
toll-booth is 26 seconds. What is...
asked 4 hours ago -
(a) A piston at 6.1 atm contains a gas that occupies a volume of
3.5 L....
asked 5 hours ago -
Please answer true or false. Words
cannot be changed or added in to make it true...
asked 5 hours ago -
An empty test tube weighs 15.923 grams. Then,
MgCl2•6H2O is added into the test tube. After...
asked 5 hours ago -
Assume memory access is 10 units of time and disk access is
10000 units of time....
asked 5 hours ago -
1. Are all good samples random?
2. Magazines often report surveys giving statistics such as “63%...
asked 5 hours ago