
Homework Answers
2a) We assume that the distribution has rate . Then
Thus from CLT we get
2b) R Program
##Question 2(b)
la=2
rep=10000
w=numeric(rep)
f=function(n)
{
for(i in 1:rep)
{
x=rexp(n,rate=2)
w[i]=sqrt(n)*(mean(x)-(1/2))/(1/2)
}
hist(w,main="Histogram",col="red",xlab="")
text(4,1225,labels=n)
}
par(mfrow=c(2,2))
f(5)
f(10)
f(20)
f(50)
R OUTPUT

From the histogram (the numerical figure on the graph indicates value of n), we find that as n increases, histogram becomes closer to that of a standard normal distribution.
3. R Program
## Question 3
la=2
rep=10000
w=numeric(rep)
g=function(n)
{
for(i in 1:rep)
{
x=rexp(n,rate=2)
w[i]=sqrt(n)*(mean(x)-(1/2))/(1/2)
}
qqnorm(w,main="Q-Q Plot",col="green",xlab="")
text(-3,3,labels=n)
}
par(mfrow=c(2,2))
g(5)
g(10)
g(20)
g(50)
R OUTPUT
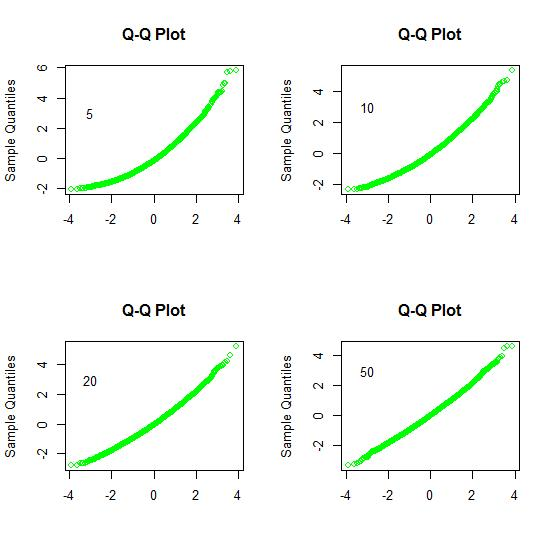
From the Q-Q plot(the numerical figure on the graph indicates value of n), we find that as n increases, more and more points are concentrating on a straightline. Hence the distribution becomes close to normal with increase in n.
Add Answer to:
1) Drawt (b) The normal f. with -50, ơ-10 (d) The expogEntial Ad.f with parameter λ...
I must use R Program to solve them. Please help! Thank you ünif uniform random variable...
 I must use R Program to solve
them. Please help! Thank you
ünif uniform random variable 1) Draw the graphs of the p.d.f. of the following distributions (a) The standard normal p.d.f (b) The normal pdf with ? = 50, ? = 10 (c) The uniform p.d.f. over interval [10, 20] (d) The exponential P.d.f with parameter ? 4. 2) Illustrating the central limit theorem. Let X be a random variable having the uniform distribution over the interval [6, 12]...
I must use R Program to solve
them. Please help! Thank you
ünif uniform random variable 1) Draw the graphs of the p.d.f. of the following distributions (a) The standard normal p.d.f (b) The normal pdf with ? = 50, ? = 10 (c) The uniform p.d.f. over interval [10, 20] (d) The exponential P.d.f with parameter ? 4. 2) Illustrating the central limit theorem. Let X be a random variable having the uniform distribution over the interval [6, 12]...
R commands 2) Illustrating the central limit theorem. X, X, X, a sequence of independent random variables with the same distribution as X. Define the sample mean X by X = A + A 2 be a random va...
 R commands
2) Illustrating the central limit theorem. X, X, X, a sequence of independent random variables with the same distribution as X. Define the sample mean X by X = A + A 2 be a random variable having the exponential distribution with A -2. Denote by -..- The central limit theorem applied to this particular case implices that the probability distribution of converges to the standard normal distribution for certain values of u and o (a) For what...
R commands
2) Illustrating the central limit theorem. X, X, X, a sequence of independent random variables with the same distribution as X. Define the sample mean X by X = A + A 2 be a random variable having the exponential distribution with A -2. Denote by -..- The central limit theorem applied to this particular case implices that the probability distribution of converges to the standard normal distribution for certain values of u and o (a) For what...
Simulate n values of an exponential random variable X with parameter λ (of your choice), and comp...
 Simulate n values of an exponential random variable X with parameter λ (of your choice), and compute the sample mean i, sample median m, sample standard deviation s. Plot these quantities as functions of n (on three separate plots). Do x, m, and s converge to any limit values, as n-oo? What are those values and how are they related? Estimate the variance of both x and m for a particular value of n, such as n 100 (by generating,...
Homework: Q Sampling Distn... CLT Save Score: 0 of 1 pt HW Score: 18.25%, 3.83 of...
 Homework: Q Sampling Distn... CLT Save Score: 0 of 1 pt HW Score: 18.25%, 3.83 of 21 pts 2 of 8 (8 complete) X 8.1.8 Question Help simple random sample of sizen 44 is obtained from a population with u 31 and o approximately normally distributed? Why? What is the sampling distribution of x? 6. Does the population need to be normally distributed for the sampling distribution of x to be Does the population need to be normally distributed for...
Central Limit Theorem Data is drawn from a normal distribution with a mean of 50 and...
 Central Limit Theorem Data is drawn from a normal distribution with a mean of 50 and a standard deviation of is. A sample of 100 is taken and the sample meen computed of what is the mean of the sample mean of 100 of the b) what is sample the standard deviation mean of 100 what is the probability that the Sample mean is less than 48 CUMULATIVE I X NORM, DIST Case I
13 14 15 16 17 18 19 2 3 4 5 6 7 8 9 10...
 13 14 15 16 17 18 19 2 3 4 5 6 7 8 9 10 If you are using the a sample of 50, must you assume that the population is normally distributed? Yes, since nothing is known about the distribution of the population, ft must be assumed that the population is normally distributed No, because the Central Limit Theorem almost always ensures that is normally distributed when n is large. In this case, the value of n is...
: Let Yi, ½' . . . , Yn be an iid random sample from an exponential distribution with parameter where θ > 0. Here each Y, represents the lifetime of the ith battery, while θ represents the the...
 : Let Yi, ½' . . . , Yn be an iid random sample from an exponential distribution with parameter where θ > 0. Here each Y, represents the lifetime of the ith battery, while θ represents the theoretical average lifetime. The pdf of each Y, is therefore given by fy (y) ei-1,2,...,n Consider the empirical average lifetime of the sample of n batteries given by Let a E R be a nonnegative real number. Consider the event A, defined...
k - The Central Limit Theorem 831 and ơ--34.4. You intend to draw a random A...
 k - The Central Limit Theorem 831 and ơ--34.4. You intend to draw a random A population of values has a normal distribution with sample of size n 164. Find P13, which is the mean separating the bottom 13% means from the top 87% means. Pi (for sample means)- Enter your answers as numbers accurate to I decimal place. Answers obtained using exact z-scores or z-scores rounded to 3 decimal places are accepted. Points possible:1 Unlimited attempts. License THeule rk-...
(a)Suppose X ∼ Poisson(λ) and Y ∼ Poisson(γ) are independent, prove that X + Y ∼...
(a)Suppose X ∼ Poisson(λ) and Y ∼ Poisson(γ) are independent, prove that X + Y ∼ Poisson(λ + γ). (b)Let X1, . . . , Xn be an iid random sample from Poisson(λ), provide a sufficient statistic for λ and justify your answer. (c)Under the setting of part (b), show λb = 1 n Pn i=1 Xi is consistent estimator of λ. (d)Use the Central Limit Theorem to find an asymptotic normal distribution for λb defined in part (c), justify...
Using R, Exercise 4 (CLT Simulation) For this exercise we will simulate from the exponential distribution....
 Using R,
Exercise 4 (CLT Simulation) For this exercise we will simulate from the exponential distribution. If a random variable X has an exponential distribution with rate parameter A, the pdf of X can be written for z 2 0 Also recall, (a) This exercise relies heavily on generating random observations. To make this reproducible we will set a seed for the randomization. Alter the following code to make birthday store your birthday in the format yyyymmdd. For example, William...
Using R,
Exercise 4 (CLT Simulation) For this exercise we will simulate from the exponential distribution. If a random variable X has an exponential distribution with rate parameter A, the pdf of X can be written for z 2 0 Also recall, (a) This exercise relies heavily on generating random observations. To make this reproducible we will set a seed for the randomization. Alter the following code to make birthday store your birthday in the format yyyymmdd. For example, William...
 I must use R Program to solve
them. Please help! Thank you
ünif uniform random variable 1) Draw the graphs of the p.d.f. of the following distributions (a) The standard normal p.d.f (b) The normal pdf with ? = 50, ? = 10 (c) The uniform p.d.f. over interval [10, 20] (d) The exponential P.d.f with parameter ? 4. 2) Illustrating the central limit theorem. Let X be a random variable having the uniform distribution over the interval [6, 12]...
I must use R Program to solve
them. Please help! Thank you
ünif uniform random variable 1) Draw the graphs of the p.d.f. of the following distributions (a) The standard normal p.d.f (b) The normal pdf with ? = 50, ? = 10 (c) The uniform p.d.f. over interval [10, 20] (d) The exponential P.d.f with parameter ? 4. 2) Illustrating the central limit theorem. Let X be a random variable having the uniform distribution over the interval [6, 12]...
 R commands
2) Illustrating the central limit theorem. X, X, X, a sequence of independent random variables with the same distribution as X. Define the sample mean X by X = A + A 2 be a random variable having the exponential distribution with A -2. Denote by -..- The central limit theorem applied to this particular case implices that the probability distribution of converges to the standard normal distribution for certain values of u and o (a) For what...
R commands
2) Illustrating the central limit theorem. X, X, X, a sequence of independent random variables with the same distribution as X. Define the sample mean X by X = A + A 2 be a random variable having the exponential distribution with A -2. Denote by -..- The central limit theorem applied to this particular case implices that the probability distribution of converges to the standard normal distribution for certain values of u and o (a) For what...
 Simulate n values of an exponential random variable X with parameter λ (of your choice), and compute the sample mean i, sample median m, sample standard deviation s. Plot these quantities as functions of n (on three separate plots). Do x, m, and s converge to any limit values, as n-oo? What are those values and how are they related? Estimate the variance of both x and m for a particular value of n, such as n 100 (by generating,...
 Homework: Q Sampling Distn... CLT Save Score: 0 of 1 pt HW Score: 18.25%, 3.83 of 21 pts 2 of 8 (8 complete) X 8.1.8 Question Help simple random sample of sizen 44 is obtained from a population with u 31 and o approximately normally distributed? Why? What is the sampling distribution of x? 6. Does the population need to be normally distributed for the sampling distribution of x to be Does the population need to be normally distributed for...
 Central Limit Theorem Data is drawn from a normal distribution with a mean of 50 and a standard deviation of is. A sample of 100 is taken and the sample meen computed of what is the mean of the sample mean of 100 of the b) what is sample the standard deviation mean of 100 what is the probability that the Sample mean is less than 48 CUMULATIVE I X NORM, DIST Case I
 13 14 15 16 17 18 19 2 3 4 5 6 7 8 9 10 If you are using the a sample of 50, must you assume that the population is normally distributed? Yes, since nothing is known about the distribution of the population, ft must be assumed that the population is normally distributed No, because the Central Limit Theorem almost always ensures that is normally distributed when n is large. In this case, the value of n is...
 : Let Yi, ½' . . . , Yn be an iid random sample from an exponential distribution with parameter where θ > 0. Here each Y, represents the lifetime of the ith battery, while θ represents the theoretical average lifetime. The pdf of each Y, is therefore given by fy (y) ei-1,2,...,n Consider the empirical average lifetime of the sample of n batteries given by Let a E R be a nonnegative real number. Consider the event A, defined...
 k - The Central Limit Theorem 831 and ơ--34.4. You intend to draw a random A population of values has a normal distribution with sample of size n 164. Find P13, which is the mean separating the bottom 13% means from the top 87% means. Pi (for sample means)- Enter your answers as numbers accurate to I decimal place. Answers obtained using exact z-scores or z-scores rounded to 3 decimal places are accepted. Points possible:1 Unlimited attempts. License THeule rk-...
 Using R,
Exercise 4 (CLT Simulation) For this exercise we will simulate from the exponential distribution. If a random variable X has an exponential distribution with rate parameter A, the pdf of X can be written for z 2 0 Also recall, (a) This exercise relies heavily on generating random observations. To make this reproducible we will set a seed for the randomization. Alter the following code to make birthday store your birthday in the format yyyymmdd. For example, William...
Using R,
Exercise 4 (CLT Simulation) For this exercise we will simulate from the exponential distribution. If a random variable X has an exponential distribution with rate parameter A, the pdf of X can be written for z 2 0 Also recall, (a) This exercise relies heavily on generating random observations. To make this reproducible we will set a seed for the randomization. Alter the following code to make birthday store your birthday in the format yyyymmdd. For example, William...
Most questions answered within 3 hours.
-
Consider a binomial experiment with n = 9 trials where the
probability of success on a...
asked 7 minutes ago -
Find the percentage of the total work lost to friction if 20.8 J
of work is...
asked 10 minutes ago -
1.why should every employee should know his rights in the
workplace?
2.why the industrial officer union...
asked 7 minutes ago -
6. Given the following equations:
(i) 3 A2+ + 2 D → 3 A + 2...
asked 10 minutes ago -
Consider the oscillator position x=2 cos(2π t), where time t is
measured in seconds. What is...
asked 11 minutes ago -
A firm has beginning inventory of 340 units at a cost of $9
each. Production during...
asked 26 minutes ago -
Find the standard deviation of the following 6 price values of
the S & P 500...
asked 32 minutes ago -
Suppose Chris is offered the following gamble: with probability
0.1 he will win $90, with probability...
asked 34 minutes ago -
Adil knows that he has one of 3 possible liquid unknowns:
tetrahyrofuran (bp 65-67°C), ethyl acetate...
asked 45 minutes ago -
Fill in with the correct letters:
When considering a Supply and demand curve, what happens in...
asked 45 minutes ago -
Fiscal stimulus is weaker in an open economy because the
greater aggregate demand resulting from the...
asked 49 minutes ago -
Identify the components of replication, transcription, and
translation processes.
Replication
transcription
translation
DNA polymerase, deoxynucleoside triphosphate,...
asked 53 minutes ago