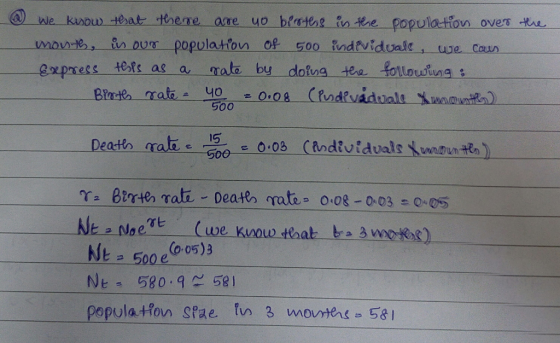
a) You are studying a population of aphids with an initial population size of 500. During a one-month period, you observe 40 births and 15 deaths in the population. Estimate the value of r for that month, and predict the population size in three months (from the initial population size). Remember that r is the per capita rate of population increase. (Assume exponential population growth).
b) Imagine you are growing ciliates in a laboratory flask. The carrying capacity is 1000 ciliates, and r is 0.2 individual / (individual X month). Assuming the population is growing according to the logistic model, what is the maximum growth rate the population can achieve?
c) Imagine you are studying competition between red and gray
squirrels on campus. For the red squirrel, K1 = 100 and
α = 2. For the gray squirrel, K2 = 150 and β = 3. Graph
the phase plane diagram and zero growth isoclines for each species.
If the initial population

Homework Answers

Add Answer to:
a) You are studying a population of aphids with an initial
population size of 500. During...
You are studying a population of beetles whose population size was initially 2000. After one month...
You are studying a population of beetles whose population size was initially 2000. After one month of observations, you record 300 births and 125 deaths. Calculate b, d and r for this population. Based on your calculations, how many beetles will there be in another month?
3. The graph below has axes to show the population sizes of a predator and its...
 3. The graph below has axes to show the population sizes of a predator and its prey. The dashed lines are the predator and prey isoclines. Prey Population Starting at the circle, draw in what will happen to the two populations if they are following the pattern in the Lotka-Volterra model of predation. (Remember that BOTH predator and prey numbers are represented by a point on the graph.) Use a series of arrows to show what happens. 2. Imagine two...
Competition 1) You are studying competition between redbreast sunfish and green sunfish in a loca...
 Ecology Homework Questions help! Thank you in advance!
Competition 1) You are studying competition between redbreast sunfish and green sunfish in a local stream. For the redbreast sunfish, K1-200 and α12-0.8. For the green sunfish, K2-150 and α21-0.6. Suppose the initial population sizes are 75 redbreast sunfish and 50 green sunfish. Graph the state space and isoclines for each species, and plot these initial population sizes. Predict the short-term dynamics of each population and the final outcome of interspecific competition....
Ecology Homework Questions help! Thank you in advance!
Competition 1) You are studying competition between redbreast sunfish and green sunfish in a local stream. For the redbreast sunfish, K1-200 and α12-0.8. For the green sunfish, K2-150 and α21-0.6. Suppose the initial population sizes are 75 redbreast sunfish and 50 green sunfish. Graph the state space and isoclines for each species, and plot these initial population sizes. Predict the short-term dynamics of each population and the final outcome of interspecific competition....
1. In Eastern Gray Squirrels, the allele for Greay coat color (G) is dominant to the...
1. In Eastern Gray Squirrels, the allele for Greay coat color (G) is dominant to the allele for black coat color (g). In a population of 200 squirrels, there are 18 black squirrels. The population is in Hardy-Weinberg equilibrium. a. What is the genotype of the 18 black squirrels? b. What is the frequency of the bb genotype in this population? c. What is the frequency of the b allele? d. What is the frequency of the B allele? e....
Number of aphids present per day EXERCISE 1 Understanding Population Growth with optimal conditions (eg, unrestricted...
 Number of aphids present per day
EXERCISE 1 Understanding Population Growth with optimal conditions (eg, unrestricted resources and low competition), some populations grow in a predicable pattern. Early growth is relatively slow, after which growth is rapid. This rapid, logarithmic phase of growth represents the organism's blotic potential, which is its maximal reproductive capacity if given unlimited resources, exponential growth. N=(a)(2) Where: N = the number of individuals of a given generation. a = the number of individuals present initially....
Number of aphids present per day
EXERCISE 1 Understanding Population Growth with optimal conditions (eg, unrestricted resources and low competition), some populations grow in a predicable pattern. Early growth is relatively slow, after which growth is rapid. This rapid, logarithmic phase of growth represents the organism's blotic potential, which is its maximal reproductive capacity if given unlimited resources, exponential growth. N=(a)(2) Where: N = the number of individuals of a given generation. a = the number of individuals present initially....
Populations grow when the number of births in a population is greater than the number of...
 Populations grow when the number of births in a population is greater than the number of deaths in the same population and there is no net movement of individuals into or out of the population. This is to say that all else being equal, populations grow when the birth rate exceeds the death rate and shrink when death rates exceed birth rates. When the number of births is equal to the number of deaths in a population, and again, there...
Stochastic Population Growth Model Next, we are going to monitor the population growth of an asexually reproducing single-celled organism, centinia lincolni (pennies). This Centina population has a m...
 Stochastic Population Growth Model Next, we are going to monitor the population growth of an asexually reproducing single-celled organism, centinia lincolni (pennies). This Centina population has a mortality rate of 50% per year, but all individuals that survive the year divide to produce an additional individual. The very most basic growth model of a closed population is: N+ N-deaths births Rewritten to use rates instead of individuals, this equation becomes: N+ -N,S+N.BS where S is the probability of survival (0.5)...
1. You are studying a color polymorphism in a population of soapberry bugs. A single gene...
1. You are studying a color polymorphism in a population of soapberry bugs. A single gene controls color variation; individuals with at least 1 copy of the R allele at this locus are red while individuals of the rr genotype are white. You know that this population satisfies the conditions for Hardy-Weinberg Equilibrium, and that 64% of the population shows the red phenotype. What is the frequency of the R allele? Show your work. 2. Male Trinidadian guppies use bright...
Section 2 Exponential Growth Population Growth 4 > To see this positive feedback, you will now...
 Section 2 Exponential Growth Population Growth 4 > To see this positive feedback, you will now calculate the expected population dire at weeks 10, 11 and 12 using the exponential growth equation. In the simulation, the initial population size, N. is 15. Your estimate ofron an earlier page in this topic should have been about 0.25. With these numbers, first calculate the value of STEP 1: Enter the value of that you calculated in the pair of Check Answer questions...
can anyone help me with these questions for ecology. thanks! the 1000 IN-dN/dt A Population size...
 can
anyone help me with these questions for ecology. thanks!
the 1000 IN-dN/dt A Population size the dN/dt = IN (K-N)/K y = 164.170.1387x bio Number of individuals 10 3512 909 95209 Time FIGURE 1 29 3 10 Time years FIGURE 4 Population densities of individual species 000.01 Environmental gradient- (such as temperature or moisture) 09 FIGURE 2 9812 909 Life table of a hypothetical population FIGURE 5 00001 Total # indiv in survivorship fecundity next time period Current #...
can
anyone help me with these questions for ecology. thanks!
the 1000 IN-dN/dt A Population size the dN/dt = IN (K-N)/K y = 164.170.1387x bio Number of individuals 10 3512 909 95209 Time FIGURE 1 29 3 10 Time years FIGURE 4 Population densities of individual species 000.01 Environmental gradient- (such as temperature or moisture) 09 FIGURE 2 9812 909 Life table of a hypothetical population FIGURE 5 00001 Total # indiv in survivorship fecundity next time period Current #...
 3. The graph below has axes to show the population sizes of a predator and its prey. The dashed lines are the predator and prey isoclines. Prey Population Starting at the circle, draw in what will happen to the two populations if they are following the pattern in the Lotka-Volterra model of predation. (Remember that BOTH predator and prey numbers are represented by a point on the graph.) Use a series of arrows to show what happens. 2. Imagine two...
 Ecology Homework Questions help! Thank you in advance!
Competition 1) You are studying competition between redbreast sunfish and green sunfish in a local stream. For the redbreast sunfish, K1-200 and α12-0.8. For the green sunfish, K2-150 and α21-0.6. Suppose the initial population sizes are 75 redbreast sunfish and 50 green sunfish. Graph the state space and isoclines for each species, and plot these initial population sizes. Predict the short-term dynamics of each population and the final outcome of interspecific competition....
Ecology Homework Questions help! Thank you in advance!
Competition 1) You are studying competition between redbreast sunfish and green sunfish in a local stream. For the redbreast sunfish, K1-200 and α12-0.8. For the green sunfish, K2-150 and α21-0.6. Suppose the initial population sizes are 75 redbreast sunfish and 50 green sunfish. Graph the state space and isoclines for each species, and plot these initial population sizes. Predict the short-term dynamics of each population and the final outcome of interspecific competition....
 Number of aphids present per day
EXERCISE 1 Understanding Population Growth with optimal conditions (eg, unrestricted resources and low competition), some populations grow in a predicable pattern. Early growth is relatively slow, after which growth is rapid. This rapid, logarithmic phase of growth represents the organism's blotic potential, which is its maximal reproductive capacity if given unlimited resources, exponential growth. N=(a)(2) Where: N = the number of individuals of a given generation. a = the number of individuals present initially....
Number of aphids present per day
EXERCISE 1 Understanding Population Growth with optimal conditions (eg, unrestricted resources and low competition), some populations grow in a predicable pattern. Early growth is relatively slow, after which growth is rapid. This rapid, logarithmic phase of growth represents the organism's blotic potential, which is its maximal reproductive capacity if given unlimited resources, exponential growth. N=(a)(2) Where: N = the number of individuals of a given generation. a = the number of individuals present initially....
 Populations grow when the number of births in a population is greater than the number of deaths in the same population and there is no net movement of individuals into or out of the population. This is to say that all else being equal, populations grow when the birth rate exceeds the death rate and shrink when death rates exceed birth rates. When the number of births is equal to the number of deaths in a population, and again, there...
 Stochastic Population Growth Model Next, we are going to monitor the population growth of an asexually reproducing single-celled organism, centinia lincolni (pennies). This Centina population has a mortality rate of 50% per year, but all individuals that survive the year divide to produce an additional individual. The very most basic growth model of a closed population is: N+ N-deaths births Rewritten to use rates instead of individuals, this equation becomes: N+ -N,S+N.BS where S is the probability of survival (0.5)...
 Section 2 Exponential Growth Population Growth 4 > To see this positive feedback, you will now calculate the expected population dire at weeks 10, 11 and 12 using the exponential growth equation. In the simulation, the initial population size, N. is 15. Your estimate ofron an earlier page in this topic should have been about 0.25. With these numbers, first calculate the value of STEP 1: Enter the value of that you calculated in the pair of Check Answer questions...
 can
anyone help me with these questions for ecology. thanks!
the 1000 IN-dN/dt A Population size the dN/dt = IN (K-N)/K y = 164.170.1387x bio Number of individuals 10 3512 909 95209 Time FIGURE 1 29 3 10 Time years FIGURE 4 Population densities of individual species 000.01 Environmental gradient- (such as temperature or moisture) 09 FIGURE 2 9812 909 Life table of a hypothetical population FIGURE 5 00001 Total # indiv in survivorship fecundity next time period Current #...
can
anyone help me with these questions for ecology. thanks!
the 1000 IN-dN/dt A Population size the dN/dt = IN (K-N)/K y = 164.170.1387x bio Number of individuals 10 3512 909 95209 Time FIGURE 1 29 3 10 Time years FIGURE 4 Population densities of individual species 000.01 Environmental gradient- (such as temperature or moisture) 09 FIGURE 2 9812 909 Life table of a hypothetical population FIGURE 5 00001 Total # indiv in survivorship fecundity next time period Current #...
Most questions answered within 3 hours.
-
While rotating the tires on your car you notice a rock [mass =
0.1 Kg] stuck...
asked 15 minutes ago -
Using MARS simulator, write MIPS programs according to
the following scenarios: Receive a positive integer number...
asked 2 hours ago -
An object in front of a concave mirror has a real image that is
11.5 cm...
asked 2 hours ago -
Consider the reaction, C3 H8 + O2 --> CO2 + H2O. How many
moles of O2...
asked 4 hours ago -
You and your opponent both roll a fair die. If you both roll the
same number,...
asked 4 hours ago -
In a study of the accuracy of fast food drive-through orders,
Restaurant A had 257 accurate...
asked 4 hours ago -
Identify and describe in detail the four categories of
institutions that could be included in a...
asked 4 hours ago -
In python
class Customer:
def __init__(self, customer_id, last_name, first_name, phone_number, address):
self._customer_id = int(customer_id)
self._last_name =...
asked 4 hours ago -
What is an example of a limitation in implementing a new
ERP system and how it...
asked 4 hours ago -
In a section of 9.7cm of an artery with a radius of 2.6mm there
is a...
asked 4 hours ago -
the two carboxylic acid groups of aspartic acid have different
acidities with pKa values of 2.1...
asked 4 hours ago -
Would CuCO3 aqueous salt combined with calcium chloride
form a solid precipitate? If so, what would...
asked 4 hours ago