Salmon (Raw Data, Software Required): Assume that the weights of Chinook Salmon in the Columbia River...
Salmon (Raw Data, Software Required):
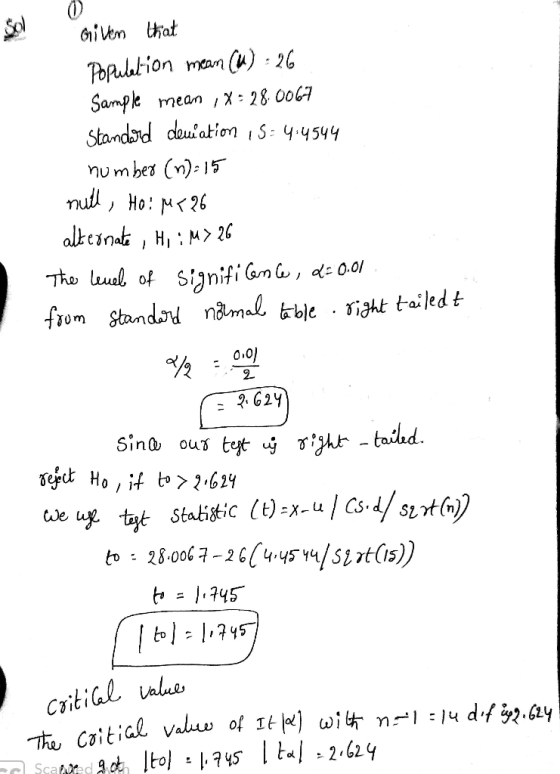
Assume that the weights of Chinook Salmon in the Columbia River are
normally distributed. You randomly catch and weigh 15 such salmon.
The data is found in the table below. Test the claim that the mean
weight of Columbia River salmon is greater than 26 pounds. Test
this claim at the 0.10 significance level.
(a) What type of test is this? This is a left-tailed test.This is a two-tailed test. This is a right-tailed test. (b) What is the test statistic? Round your answer to 2 decimal places. tx = (c) Use software to get the P-value of the test statistic. Round to 4 decimal places. P-value = |
DATA ( n = 15 ) Salmon Weights
|
Homework Answers

Add Answer to:
Salmon (Raw Data, Software Required):
Assume that the weights of Chinook Salmon in the Columbia River...
Salmon Weights (Raw Data, Software Required): Assume that the weights of spawning Chinook salmon in the...
Salmon Weights (Raw Data, Software Required): Assume that the weights of spawning Chinook salmon in the Columbia river are normally distributed. You randomly catch and weigh 15 such salmon. The data is found in the table below. You want to construct a 90% confidence interval for the mean weight of all spawning Chinook salmon in the Columbia River. You will need software to answer these questions. You should be able to copy the data directly from the table into your...
How do I figure this out Salmon: Assume that the weights of Chinook Salmon in the...
How do I figure this out Salmon: Assume that the weights of Chinook Salmon in the Columbia River are normally distributed. You randomly catch and weigh 30 such salmon. The mean weight from your sample is 24.0 pounds with a standard deviation of 2.5 pounds. Test the claim that the mean weight of Columbia River salmon is greater than 23 pounds. Test this claim at the 0.10 significance level. (a) What type of test is this? This is a left-tailed...
Salmon Weights: Assume that the weights of spawning Chinook salmon in the Columbia river are normally...
Salmon Weights: Assume that the weights of spawning Chinook salmon in the Columbia river are normally distributed. You randomly catch and weigh 25 such salmon. The mean weight from your sample is 19.2 pounds with a standard deviation of 4.6 pounds. You want to construct a 99% confidence interval for the mean weight of all spawning Chinook salmon in the Columbia River. (a) What is the point estimate for the mean weight of all spawning Chinook salmon in the Columbia...
Sibling IQ Scores (Raw Data, Software Required): There have been numerous studies involving the correlation and...
Sibling IQ Scores (Raw Data, Software Required): There have been numerous studies involving the correlation and differences in IQ's among siblings. Here we consider a small example of such a study. We will test the claim that, on average, older siblings have a higher IQ than their younger sibling. The results are depicted for a sample of 10 siblings in the table below. Test the claim at the 0.05 significance level. You may assume the sample of differences comes from...
Sleep (Raw Data, Software Required): Assume the general population gets an average of 7 hours of...
Sleep (Raw Data, Software Required): Assume the general population gets an average of 7 hours of sleep per night. You randomly select 35 college students and survey them on the number of hours of sleep they get per night. The data is found in the table below. You claim that college students get less sleep than the general population. That is, you claim the mean number of hours of sleep for all college students is less than 7 hours. Test...
Math & Music (Raw Data, Software Required): There is a lot of interest in the relationship...
Math & Music (Raw Data, Software Required): There is a lot of interest in the relationship between studying music and studying math. We will look at some sample data that investigates this relationship. Below are the Math SAT scores from 8 students who studied music through high school and 11 students who did not. Test the claim that students who study music in high school have a higher average Math SAT score than those who do not. Test this claim...
Math & Music (Raw Data, Software Required): There is a lot of interest in the relationship...
 Math & Music (Raw Data, Software Required): There is a lot of interest in the relationship between studying music and studying math. We will look at some sample data that investigates this relationship. Below are the Math SAT scores from 8 students who studied music through high school and 11 students who did not. Test the claim that students who study music in high school have a higher average Math SAT score than those who do not. Test this claim...
Tomato weights and Fertilizer (Raw Data, Software Required): Carl the farmer has three fields of tomatoes,...
Tomato weights and Fertilizer (Raw Data, Software Required): Carl the farmer has three fields of tomatoes, on one he used no fertilizer, in another he used organic fertilizer, and the third he used a chemical fertilizer. He wants to see if there is a difference in the mean weights of tomatoes from the different fields. The sample data for tomato-weights in grams is given below. Carl claims there is a difference in the mean weight for all tomatoes between the...
Math SAT Scores (Raw Data, Software Required): Suppose the national mean SAT score in mathematics is...
Math SAT Scores (Raw Data, Software Required): Suppose the national mean SAT score in mathematics is 510. The scores from a random sample of 40 graduates from Stevens High are given in the table below. Use this data to test the claim that the mean SAT score for all Stevens High graduates is the same as the national average. Test this claim at the 0.05 significance level. (a) What type of test is this? This is a left-tailed test. This...
Foot-Length (Raw Data, Software Required): It has been claimed that, on average, right-handed people have a...
Foot-Length (Raw Data, Software Required): It has been claimed that, on average, right-handed people have a left foot that is larger than the right foot. Here we test this claim on a sample of 10 right-handed adults. The table below gives the left and right foot measurements in millimeters (mm). Test the claim at the 0.01 significance level. You may assume the sample of differences comes from a normally distributed population. Person Left Foot (x) Right Foot (y) 1 269...
 Math & Music (Raw Data, Software Required): There is a lot of interest in the relationship between studying music and studying math. We will look at some sample data that investigates this relationship. Below are the Math SAT scores from 8 students who studied music through high school and 11 students who did not. Test the claim that students who study music in high school have a higher average Math SAT score than those who do not. Test this claim...
Most questions answered within 3 hours.
-
Experimental studies of cancer often use strains of animals that
have a naturally high incidence of...
asked 1 minute ago -
Sociology Question Emile Durkheim
What role does mass media play in the lives of contemporary
citizens?...
asked 5 minutes ago -
Why would you silence gene expression for both wild-type and
mutants? I am on a question...
asked 14 minutes ago -
While all of the elements below are helpful, Booth et al. (2008)
emphasize that it is...
asked 19 minutes ago -
2. Use the three-step method to analyze the effects of the event
on the equilibrium price...
asked 19 minutes ago -
Draw a Venn diagram of three domains of life and explain.
asked 23 minutes ago -
In testing a new drug, researchers found that 5% of all patients
using it will have...
asked 52 minutes ago -
List the six general types of information management systems,
and give one logistics application to each...
asked 43 minutes ago -
XYZ corporation uses statistical quality control to monitor the
quality of their product. They have determined...
asked 46 minutes ago -
If a liquid
contains 60% sugar and 40% water through out its composition then
what is...
asked 54 minutes ago -
The data in set A represents prices (with tax included) of a
large cup of regular...
asked 1 hour ago -
How do neuropsychological assessments provide information about
impairment? How could this information be misused?
asked 56 minutes ago