MUST SHOW ALL CELL FORMULAS
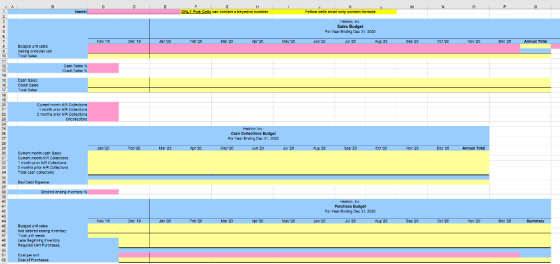
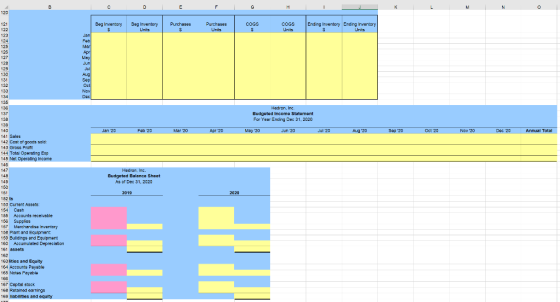
Required: You need to prepare a comprehensive 12-month budget, including supporting schedules and a report for the period January 1, 2020 to December 31, 2020 for Hedron, Inc.
INFORMATION FOR HEDRON, INC.
Hedron, Inc. is a company that re-sells one product, a particularly comfortable lawn chair. An overseas contractor makes the product exclusively for Hedron, so Hedron has no manufacturing related costs.
PRODUCT COSTS
In Nov of 2019, each lawn chair costs Hedron $4 per unit. Per an existing contract, the cost of each chair is scheduled to increase by 5% on May 1, 2020. In addition, because of increasing costs of plastic webbing, the cost is anticipated to increase by an additional 5% on Sept 1, 2020.
PRODUCT SALES
Hedron sells each chair for $10 per unit.
Projected Sales units:
|
Year |
Month |
Amt |
|
2019 |
Nov |
11,250 |
|
Dec |
11,600 |
|
|
2020 |
Jan |
10,000 |
|
Feb |
11,400 |
|
|
Mar |
12,600 |
|
|
Apr |
15,000 |
|
|
May |
18,000 |
|
|
Jun |
22,000 |
|
|
Jul |
18,000 |
|
|
Aug |
18,000 |
|
|
Sep |
17,000 |
|
|
Oct |
16,500 |
|
|
Nov |
12,000 |
|
|
Dec |
12,500 |
|
|
2021 |
Jan |
11,000 |
To offset increasing costs of the chairs, the company plans to raise the sales price to $11.25 per unit beginning Sept 1, 2020. The sales forecast (i.e., estimated sales in units) takes this price increase into account.
CREDIT SALES
Monthly sales are 30% cash sales, 70% credit sales. 30% of credit sales are collected in the month of sale, 50% are collected the following month, and 16% are collected the 2nd month after sale. The remaining receivables are deemed uncollectible at the end of the 2nd month after sale. Bad debts are written off in the month the debt is deemed uncollectible
PRODUCT INVENTORY
The firm’s policy regarding inventory is to maintain their stock (i.e. have in ending inventory) at 40% of the forecasted sales in units for the next month. Hedron uses the first-in, first-out (FIFO) method in accounting for inventories.
40% of the inventory purchases are paid in the month of purchase with the remaining 60% paid the following month.
EQUIPMENT
A Note payment of $50,000 for equipment previously purchased is due in January and another Note payment of $30,000 is due in February. There are no Note Payables at the end of 2020.
OPERATING EXPENSES
Monthly Cash expenses are paid when incurred
|
Salary and Wage Exp |
$3,000 |
|
Sales Commissions Exp |
7% of sales revenue |
|
Rent Exp |
$8,000 |
|
Gen & Admin Variable Exp |
6% of sales revenue |
|
Supplies Exp |
$2,000 |
|
Gen & Admin Fixed Exp |
$24,000 |
|
Gen & Admin Depreciation Exp |
$24,000 |
(Cash expenses are paid when incurred)
CASH MANAGEMENT
The company must maintain a minimum cash balance of $15,000. Borrowing can make up shortfalls. For simplicity, assume that the bank will only lend (and accept repayments) in $1,000 increments. (Ignore interest on the loans, but minimize the amount borrowed and pay off any loans as soon as possible.)
DIVIDENDS
Dividends of $12,000 are paid in July.
BALANCE SHEET
Balance Sheet balances as of December 31, 2019:
|
Cash |
$ 15,000 |
|
Accounts Receivable |
$ 72,590 |
|
Supplies* |
$ 2,000 |
|
Merchandise Inventory |
$ 16,000 |
|
Buildings and Equipment* |
$ 1,050,000 |
|
Accumulated Depreciation |
$ 526,475 |
|
Accounts Payable |
$ 26,304 |
|
Notes Payable |
$ 80,000 |
|
Capital Stock* |
$ 200,000 |
|
Retained Earnings |
$ 322,811 |
*same balance in 2020
CHECK FIGURES
Cash Collections Budget
Total Cash Receipts for January: $ 104,200
Total Cash Receipts, Total 2020: $ 1,835,333
Bad Debt Exp for January: $ 3,150
Bad Debt Exp, Total 2020: $ 51,951
Purchase Budget
Cost of Purchases for Dec 2020: $ 52,479
Operating Expense Budget
Cash disbursements for Op Exp for Dec $ 55,281
Cash Budget
Total cash available, Summary $ 1,850,333
Total Cash Disbursements, Summary: $ 1,549,658
Ending Cash Balance for Dec: $ 300,676
Budgeted Income Statement
Gross Profit, Total: $ 1,134,388
Cost of Goods Sold Total $ 768,112
Net Income, Total: $ 103,113
Budgeted Balance Sheet
Total Assets Dec 2020: $ 645,411
_________________________________________________________


Homework Answers
Answer:
Sales Budget:

Cash Collection Budget:

Purchase Budget:

Schedule of Budgeted Cash Disbursement for Merchandise Purchase:

Operating Expenses Budget:

t
Add Answer to:
MUST SHOW ALL CELL FORMULAS
Required: You need to prepare a comprehensive
12-month budget, including supporting...
Moving average (MA) Calculate the sales using 2, 3, 4, 5, and 6 month moving average...
Moving average (MA) Calculate the sales using 2, 3, 4, 5, and 6 month moving average values. Forecast and plot the upcoming period’s sales using the moving average series that fits best. Explain why you chose that particular MA. Why is it inadvisable to use the Moving Average approach to forecast far into the future? Month Sale Month Sale Month Sale Oct-12 13.30 Oct-13 24.01 Oct-14 50.56 Nov-12 1.70 Nov-13 32.67 Nov-14 60.06 Dec-12 11.44 Dec-13 23.19 Dec-14 61.73 Jan-13...
what formulas would I use to work out these calculations? Please help!! You complete using any...
 what formulas would I use to work out these calculations?
Please help!!
You complete using any method you've learnt This is done for you You complete Financial Year Summary Sheet Patron Revenue Total Product Profit Total Staff Cost Gross Profit Monthly Profit Jul-18) Aug-18 Sep-18 Oct-18 Nov-18 Dec-18 Jan-19 Feb-19 Mar-19 Apr-19 May-19 Jun-19 Monthly Fixed Costs $ 23,800 $ 23,800 $ 23,800 $ 23,800 $ 23,800 $ 23,800 $ 29,500 $ 29,500 $ 29,500 $ 29,500 $ 29,500 $...
what formulas would I use to work out these calculations?
Please help!!
You complete using any method you've learnt This is done for you You complete Financial Year Summary Sheet Patron Revenue Total Product Profit Total Staff Cost Gross Profit Monthly Profit Jul-18) Aug-18 Sep-18 Oct-18 Nov-18 Dec-18 Jan-19 Feb-19 Mar-19 Apr-19 May-19 Jun-19 Monthly Fixed Costs $ 23,800 $ 23,800 $ 23,800 $ 23,800 $ 23,800 $ 23,800 $ 29,500 $ 29,500 $ 29,500 $ 29,500 $ 29,500 $...
Consider five years of monthly sales data for a company in the attached file (Q5.xlsx). a) Foreca...
 Consider five years of monthly sales data for a company in the
attached file (Q5.xlsx). a) Forecast monthly sales for the next
year (2020). (10 marks) b) Discuss whether a simple exponential
smoothing model works well with this data or not. (5 m
7 9 Month Sales 747 Feb-14 697 Mar-14 1014 Jan-14 Ap4 1126 May-14 1105 Jun-14 1450 Jul-14 1633 Aug-14 1711 Sep-14 1307 Oct-1223 Nov-14 9T5 Dec-14S53 4J-15 1024 Feb-15928 Mar-151442 7Apr-151371 May-15 1536 Ju15 2004 Jul-15 1854...
Consider five years of monthly sales data for a company in the
attached file (Q5.xlsx). a) Forecast monthly sales for the next
year (2020). (10 marks) b) Discuss whether a simple exponential
smoothing model works well with this data or not. (5 m
7 9 Month Sales 747 Feb-14 697 Mar-14 1014 Jan-14 Ap4 1126 May-14 1105 Jun-14 1450 Jul-14 1633 Aug-14 1711 Sep-14 1307 Oct-1223 Nov-14 9T5 Dec-14S53 4J-15 1024 Feb-15928 Mar-151442 7Apr-151371 May-15 1536 Ju15 2004 Jul-15 1854...
calculate the monthly time-weighted and money weighted returns for shareholders in the ADKSX with using excel....
calculate the monthly time-weighted and money weighted returns for shareholders in the ADKSX with using excel. In a text box nearby, comment on whether investors’ trading decisions have created value. Month ADKSX Return (%) ADKSX Cash Flow ($) Nov-09 3.49 -$10,648,393 Dec-09 6.93 -$618,800 Jan-10 -2.05 $940,820 Feb-10 5.74 -$2,484,437 Mar-10 5.19 -$3,699,836 Apr-10 5.48 -$1,379,757 May-10 -4.68 $2,145,936 Jun-10 -6.31 -$2,953,884 Jul-10 5.9 -$4,160,472 Aug-10 -5.18 $1,096,304 Sep-10 8.61 -$5,571,657 Oct-10 4.5 -$669,464 Nov-10 2.77 -$3,145,367 Dec-10 9.16 -$6,162,018...
The line graph represents the monthly revenue of a small music venue in the form of...
 The line graph represents the monthly revenue of a small music venue in the form of ticket sales, food and beverage sales, and merchandise sales for the past year. Use the graph to estimate the total revenue for the month of July. Monthly Revenue for Music Venue 10000 + Ticket Sales Revenue (in Dollars) 4 Food and Beverage • Merchandise Jan Feb Mar Apr May Aug Sep Oct Nov Dec Jun Jul Month Prev Answer(How to Enter) 2 Points Keypad
Given the following data, what is the Mean Absolute Deviation (MAD): Month Demand Forecast Jan 100...
Given the following data, what is the Mean Absolute Deviation (MAD): Month Demand Forecast Jan 100 110 Feb 100 100 Mar 120 100 Apr 110 90 May 100 110 Jun 90 100 Jul 80 90 Aug 90 80 Sep 100 110 Oct 110 100 Nov 110 110 Dec 120 110 A. 10 B. 20 C. 30 D. 133.33
Complete the following program in C; Have the user input the current month and return the...
Complete the following program in C; Have the user input the current month and return the previous month. E.g. input -> 3, returns 2 input -> 1, returns 12 #include <stdio.h> #include <stdlib.h> /* Write a function called previous_month that returns the previous month. start with the following code */ enum month {jan = 1, feb, mar, apr, may, jun, jul, aug, sep, oct, nov, dec}; typedef enum month month; int main() { return0; }
AmeriPlas, Inc., produces 20-ounce plastic drinking cups that are embossed with the names of prominent beers...
AmeriPlas, Inc., produces 20-ounce plastic drinking cups that are embossed with the names of prominent beers and soft drinks. The sales data are: Date Sales Jan-13 40,358 Feb-13 45,002 Mar-13 63,165 Apr-13 57,479 May-13 52,308 Jun-13 60,062 Jul-13 51,694 Aug-13 54,469 Sep-13 48,284 Oct-13 45,239 Nov-13 40,665 Dec-13 47,968 Jan-14 37,255 Feb-14 38,521 Mar-14 55,110 Apr-14 51,389 May-14 58,068 Jun-14 64,028 Jul-14 52,873 Aug-14 62,584 Sep-14 53,373 Oct-14 52,060 Nov-14 51,727 Dec-14 51,455 Jan-15 47,906 Feb-15 53,570 Mar-15 69,189 Apr-15...
Question: Cash Receipts 25% of sales are in cash and collected in the month the sale...
Question: Cash Receipts 25% of sales are in cash and collected in the month the sale is made and 75% are on credit and collected in the month after the sale. December 2017 sales were $3 million. The sales forecast for 2018 is as follows: January 2,800,000 February 2,500,000 March 3,200,000 April 3,400,000 May 3,600,000 June 3,600,000 July 3,800,000 August 4,000,000 September 3,600,000 October 3,400,000 November 2,800,000 December 2,600,000 Cash Disbursements The disbursements for this firm are as follows: Payments...
please explain the answer. ocaut Coipany Jan Feb Mar Apr May Jun Jul Aug Sep Oct...
 please explain the answer.
ocaut Coipany Jan Feb Mar Apr May Jun Jul Aug Sep Oct Nov Dec Month Seasonal index 1.2 1.3 1.1 1.0 1.0 0.9 0.8 0.7 0.9 1 L Sales (S '000s) 9.6 10.5 8.6 1 The seasonal index for December is: 1.0 1.1 6.4 7.2 8.3 7.4 7.1 6.0 5.4 A 0.8 B 0.9 C 1.0 D 1.1 E 1.2
please explain the answer.
ocaut Coipany Jan Feb Mar Apr May Jun Jul Aug Sep Oct Nov Dec Month Seasonal index 1.2 1.3 1.1 1.0 1.0 0.9 0.8 0.7 0.9 1 L Sales (S '000s) 9.6 10.5 8.6 1 The seasonal index for December is: 1.0 1.1 6.4 7.2 8.3 7.4 7.1 6.0 5.4 A 0.8 B 0.9 C 1.0 D 1.1 E 1.2
 what formulas would I use to work out these calculations?
Please help!!
You complete using any method you've learnt This is done for you You complete Financial Year Summary Sheet Patron Revenue Total Product Profit Total Staff Cost Gross Profit Monthly Profit Jul-18) Aug-18 Sep-18 Oct-18 Nov-18 Dec-18 Jan-19 Feb-19 Mar-19 Apr-19 May-19 Jun-19 Monthly Fixed Costs $ 23,800 $ 23,800 $ 23,800 $ 23,800 $ 23,800 $ 23,800 $ 29,500 $ 29,500 $ 29,500 $ 29,500 $ 29,500 $...
what formulas would I use to work out these calculations?
Please help!!
You complete using any method you've learnt This is done for you You complete Financial Year Summary Sheet Patron Revenue Total Product Profit Total Staff Cost Gross Profit Monthly Profit Jul-18) Aug-18 Sep-18 Oct-18 Nov-18 Dec-18 Jan-19 Feb-19 Mar-19 Apr-19 May-19 Jun-19 Monthly Fixed Costs $ 23,800 $ 23,800 $ 23,800 $ 23,800 $ 23,800 $ 23,800 $ 29,500 $ 29,500 $ 29,500 $ 29,500 $ 29,500 $...
 Consider five years of monthly sales data for a company in the
attached file (Q5.xlsx). a) Forecast monthly sales for the next
year (2020). (10 marks) b) Discuss whether a simple exponential
smoothing model works well with this data or not. (5 m
7 9 Month Sales 747 Feb-14 697 Mar-14 1014 Jan-14 Ap4 1126 May-14 1105 Jun-14 1450 Jul-14 1633 Aug-14 1711 Sep-14 1307 Oct-1223 Nov-14 9T5 Dec-14S53 4J-15 1024 Feb-15928 Mar-151442 7Apr-151371 May-15 1536 Ju15 2004 Jul-15 1854...
Consider five years of monthly sales data for a company in the
attached file (Q5.xlsx). a) Forecast monthly sales for the next
year (2020). (10 marks) b) Discuss whether a simple exponential
smoothing model works well with this data or not. (5 m
7 9 Month Sales 747 Feb-14 697 Mar-14 1014 Jan-14 Ap4 1126 May-14 1105 Jun-14 1450 Jul-14 1633 Aug-14 1711 Sep-14 1307 Oct-1223 Nov-14 9T5 Dec-14S53 4J-15 1024 Feb-15928 Mar-151442 7Apr-151371 May-15 1536 Ju15 2004 Jul-15 1854...
 The line graph represents the monthly revenue of a small music venue in the form of ticket sales, food and beverage sales, and merchandise sales for the past year. Use the graph to estimate the total revenue for the month of July. Monthly Revenue for Music Venue 10000 + Ticket Sales Revenue (in Dollars) 4 Food and Beverage • Merchandise Jan Feb Mar Apr May Aug Sep Oct Nov Dec Jun Jul Month Prev Answer(How to Enter) 2 Points Keypad
 please explain the answer.
ocaut Coipany Jan Feb Mar Apr May Jun Jul Aug Sep Oct Nov Dec Month Seasonal index 1.2 1.3 1.1 1.0 1.0 0.9 0.8 0.7 0.9 1 L Sales (S '000s) 9.6 10.5 8.6 1 The seasonal index for December is: 1.0 1.1 6.4 7.2 8.3 7.4 7.1 6.0 5.4 A 0.8 B 0.9 C 1.0 D 1.1 E 1.2
please explain the answer.
ocaut Coipany Jan Feb Mar Apr May Jun Jul Aug Sep Oct Nov Dec Month Seasonal index 1.2 1.3 1.1 1.0 1.0 0.9 0.8 0.7 0.9 1 L Sales (S '000s) 9.6 10.5 8.6 1 The seasonal index for December is: 1.0 1.1 6.4 7.2 8.3 7.4 7.1 6.0 5.4 A 0.8 B 0.9 C 1.0 D 1.1 E 1.2
Most questions answered within 3 hours.
-
3. Gains from trade
Consider two neighbouring island countries called Euphoria and
Contente. They each have...
asked 36 minutes ago -
A business executive has the option to invest money in two
plans: Plan A guarantees that...
asked 2 hours ago -
Hello, can someone please help me answer this question?
How much heat is absorbed by a...
asked 2 hours ago -
. A marketing researcher conducted a survey of 25 shoppers
randomly selected at the local mall...
asked 3 hours ago -
Create an comprehensive response to the
following:
Antimicrobial agents work on a multitude of microbes (bacteria,...
asked 3 hours ago -
6.13 LAB: Step counter. Section 6.3.
A pedometer treats walking 2,000 steps as walking 1 mile....
asked 3 hours ago -
(14.2) A block of mass m = 10 kg riding on a frictionless
horizontal plane is...
asked 3 hours ago -
Use any search engine to search for articles about Starbucks
partnership with Tata Companies in India...
asked 3 hours ago -
Let’s say that for some reason Bank Excess Reserves suddenly
increase sharply. What effect would this...
asked 3 hours ago -
Given:
Curent Assets: $600,000
Total Assets: $2,600,000
Current Liabilities: $500,000
Total Liabilities: $1,700,000
What is the...
asked 3 hours ago -
1. What is a “Bankster”? What is insider trading? Why is it
illegal?
2. What is...
asked 3 hours ago -
A transverse wave on a cord is given by
D(x,t)=0.18sin(2.7x−61.0t), where Dand x are in m...
asked 3 hours ago