In a certain class, test scores average out to 60, with a standard deviation of 20,...
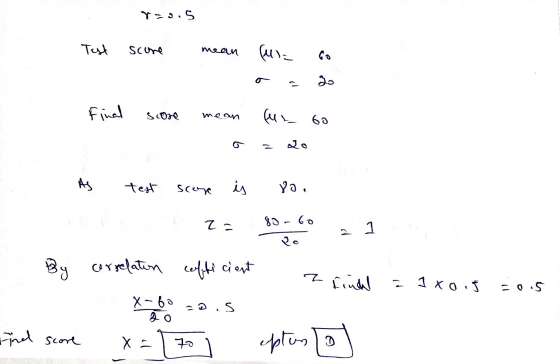
In a certain class, test scores average out to 60, with a standard deviation of 20, as do scores on the final. The correlation between test scores and the final scores is about 0.5. Estimate the average final score for the students whose test score was:
80
| A. |
67 |
|
| B. |
80 |
|
| C. |
85 |
|
| D. |
70 |
Homework Answers
Add Answer to:
In a certain class, test scores average out to 60, with a
standard deviation of 20,...
in a certain class, test scores average out to 60, with a standard deviation of 20,...
in a certain class, test scores average out to 60, with a standard deviation of 20, as do scores on the final. The correlation between test scores and the final scores is about 0.5. Estimate the average final score for the students whose test score was: 60 A. 60 B. 70 C. 50 D. 80
In a certain class, test scores average out to 60, with a standard deviation of 20,...
In a certain class, test scores average out to 60, with a standard deviation of 20, as do scores on the final. The correlation between test scores and the final scores is about 0.5. Estimate the average final score for the students whose test score was: 20 A. 20 B. 60 C. 50 D. 40
An analysis of the final test scores in this class shows that the scores follow the...
An analysis of the final test scores in this class shows that the scores follow the normal distribution. The mean of the distribution is 85 and the standard deviation is 6. The professor wants to award an A student whose score is in the highest 11% which means 89% of the class will have lower grades. What is the cut-off point (or score) for those students who earn an A versus those that earn a B? In other words, what...
Scores on a test are normally distributed with a mean of 70 and standard deviation of...
Scores on a test are normally distributed with a mean of 70 and standard deviation of 10. Applying the Empirical Rule, we would expect the middle 95% of scores to fall between what two values? 40 and 100 50 and 90 55 and 85 60 and 80 65 and 75
Everyone in the class takes a test and receives a score, and the average is calculated....
Everyone in the class takes a test and receives a score, and the average is calculated. Everyone compares their test score to the average test score, and each person’s distance from the mean test score is their deviation. People who had really low test scores or really high test scores will have large distances, or deviations, from the mean, while people who had test scores that were similar to the mean will have small distances, or deviations. If a person’s...
In a chemistry class, the average grade on the final examination was 60 with a standard...
 In a chemistry class, the average grade on the final examination was 60 with a standard deviation of 4. Use Chebyshev's theorem to answer the following questions. a. At least what percentage of students received grades between 54 to 66? b. At least what percentage of students received grades between 52 to 68 hours? C. Determine an interval for the grades that will be true for at least 80% of the students. (Hint: First compute the Z-score.)
You find out that the average 10th grade math test score for section 6 of the...
You find out that the average 10th grade math test score for section 6 of the local high school is 87 for the 25 students in the class. The average test score for all 10th grade math students across the state is 85 for 1,800 students. The standard deviation for the state is 3.8. What Z score do you calculate, and what is the area between the mean and the Z score (found on the table at the end of...
what is the standard deviation for these scores correct to one decimal place 1. The following...
 what is the standard deviation for these scores correct to one
decimal place
1. The following raw scores were obtained by 30 students on a 100-point test: 40 44 56 94 81 85 76 57 85 45 67 43 60 56 53 85 93 74 72 75 46 96 66 85 92 93 65 85 80 47
what is the standard deviation for these scores correct to one
decimal place
1. The following raw scores were obtained by 30 students on a 100-point test: 40 44 56 94 81 85 76 57 85 45 67 43 60 56 53 85 93 74 72 75 46 96 66 85 92 93 65 85 80 47
Consider the following scatterplot, regression equation, and correlation of midterm and final exam scores for a...
 Consider the following scatterplot, regression equation, and correlation of midterm and final exam scores for a class of 15 students. Which of the following are true statements? Select one answer ı points Y ะ 90.6-0.489x , r -0.602 110 100 90 80 , 5어 2 20 40 60 80 100 Mdterm Exam Score I. The same number of students scored 100 on the midterm exam as scored 100 on the final exam. II. Students who scored higher on the midterm...
Scores in an exam to measure understanding of probability before a class is taught at a...
Scores in an exam to measure understanding of probability before a class is taught at a university have an average of 35 with standard deviation 5. After the course is taught, the average exam score is 80 with standard deviation 6. There is a correlation between the pre-class and post-class score of 0.7. The scores are jointly distributed according to the bivariate normal distribution. (a) What is the probability that the post-course score (the score after the course has been...
 In a chemistry class, the average grade on the final examination was 60 with a standard deviation of 4. Use Chebyshev's theorem to answer the following questions. a. At least what percentage of students received grades between 54 to 66? b. At least what percentage of students received grades between 52 to 68 hours? C. Determine an interval for the grades that will be true for at least 80% of the students. (Hint: First compute the Z-score.)
 what is the standard deviation for these scores correct to one
decimal place
1. The following raw scores were obtained by 30 students on a 100-point test: 40 44 56 94 81 85 76 57 85 45 67 43 60 56 53 85 93 74 72 75 46 96 66 85 92 93 65 85 80 47
what is the standard deviation for these scores correct to one
decimal place
1. The following raw scores were obtained by 30 students on a 100-point test: 40 44 56 94 81 85 76 57 85 45 67 43 60 56 53 85 93 74 72 75 46 96 66 85 92 93 65 85 80 47
 Consider the following scatterplot, regression equation, and correlation of midterm and final exam scores for a class of 15 students. Which of the following are true statements? Select one answer ı points Y ะ 90.6-0.489x , r -0.602 110 100 90 80 , 5어 2 20 40 60 80 100 Mdterm Exam Score I. The same number of students scored 100 on the midterm exam as scored 100 on the final exam. II. Students who scored higher on the midterm...
Most questions answered within 3 hours.
-
Consider the reaction, C3 H8 + O2 --> CO2 + H2O. How many
moles of O2...
asked 19 minutes ago -
You and your opponent both roll a fair die. If you both roll the
same number,...
asked 36 minutes ago -
In a study of the accuracy of fast food drive-through orders,
Restaurant A had 257 accurate...
asked 36 minutes ago -
Identify and describe in detail the four categories of
institutions that could be included in a...
asked 41 minutes ago -
In python
class Customer:
def __init__(self, customer_id, last_name, first_name, phone_number, address):
self._customer_id = int(customer_id)
self._last_name =...
asked 49 minutes ago -
What is an example of a limitation in implementing a new
ERP system and how it...
asked 44 minutes ago -
In a section of 9.7cm of an artery with a radius of 2.6mm there
is a...
asked 45 minutes ago -
the two carboxylic acid groups of aspartic acid have different
acidities with pKa values of 2.1...
asked 49 minutes ago -
Would CuCO3 aqueous salt combined with calcium chloride
form a solid precipitate? If so, what would...
asked 48 minutes ago -
How do ECM Solutions assist in embedding a culture of continuous
improvement in an organization? (Project...
asked 1 hour ago -
Directions
These directions introduce the idea of Essential Questions.
Since this may be a new concept...
asked 1 hour ago -
1.b. Fiscal policy is said to suffer from ‘crowding out’.
Explain what this means and why...
asked 1 hour ago