Monthly income, in thousands of dollars ($K), at the Acme Law Firm for the six-month period...
Monthly income, in thousands of dollars ($K), at the Acme Law Firm for the six-month period from October to March is listed in the table below.
|
month |
income, $K |
|
Oct |
69.3 |
|
Nov |
68.6 |
|
Dec |
69.4 |
|
Jan |
71.7 |
|
Feb |
72.3 |
|
Mar |
74.8 |
-what is the simple exponential smoothing forecast with α = 0.1 for monthly income for April?
-what is the regression forecast for monthly income for April?
-what is the numerical value of the strength of the linear association between monthly income and month number?
-how much of the variation in monthly income is accounted for by the regression?
-what is the approximate average rate of change of monthly income?
-What forecast method is the most accurate?
what is the best forecast value for monthly income for April?
Homework Answers
1)
Simple exponential smoothing forecast with α = 0.1 for monthly income for April is computed below

EXCEL FORMULA:

Simple exponential smoothing forecast with α = 0.1 for monthly income for April = 70.28
-----------------------------------------------
2)
Regression forecast

Regression forecast for monthly income for April = 66.9266+1.1686*7 = 75.11
-----------------------------------------------
3)
Numerical value of the strength of the linear association between monthly income and month number is indicated by correlation coefficient (r)
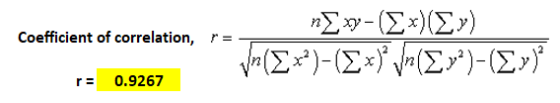
Value of r is 0.9267, which is positive and close to 1
Which means linear association between monthly income and month number is direct and strong
-----------------------------------------------
4)
How much of the variation in monthly income is accounted for by the regression
This is indicated by coefficient of determination, r2

85.87 % variation in monthly income is accounted for by the regression
-----------------------------------------------
Add Answer to:
Monthly income, in thousands of dollars ($K), at the Acme Law
Firm for the six-month period...
QUESTION 38 Monthly income, in thousands of dollars (SK), at the Acme Law Firm for the...
 QUESTION 38 Monthly income, in thousands of dollars (SK), at the Acme Law Firm for the six-month period from October to March is listed in the table below. month income, $K Oct 69.3 Nov 68.6 Dec 69.4 Jan 71.7 Feb 72.3 Mar 74.8 According to the regression analysis performed for part 41. what is the numerical value of the strength of the linear association between monthly income and month number Round to four (4) decimal places) 0.3587 0.36 1.16 0.1413...
QUESTION 38 Monthly income, in thousands of dollars (5K), at the Acme Law Firm for the...
 QUESTION 38 Monthly income, in thousands of dollars (5K), at the Acme Law Firm for the six-month period from October to March is listed in the table below. month income, $K Oct 69.3 Nov 68.6 Dec 69.4 Jan 71.7 Feb 72.3 Mar 74.8 Using the data in the table, what is the naive forecast of monthly income for April (Round to two [2] decimal places.) O $74.80K 572.93K 573.55 $75.11K O 570.28K QUESTION 39 Using the data in the table...
Question 1: The monthly sales for Telco Batteries, Inc. in a given year were as follows:...
 Question 1: The monthly sales for Telco Batteries, Inc. in a given year were as follows: Month Jan Feb Mar Apr May June July Aug Sep Oct Demand 46 47 50 49 50 48 51 49 52 53 Nov. Dec. 52 54 C. Forecast next year January sales using the following methods: I. Linear regression (You can use excel to get slope and intercept) ii. Trend adjusted exponential smoothing model. Use a = 0.2, B = 0.3, for the month...
National Scan Inc. sells radio frequency inventory tags. Monthly sales for a seven-month period were as...
National Scan Inc. sells radio frequency inventory tags. Monthly sales for a seven-month period were as follows: Month Sales (000) Units Feb 19 Mar 18 Apr 15 May 20 Jun 18 Jul 22 Aug 20 b. Forecast September sales volume using each of the following: SHOW WORKS!!!! (1) Thenaiveapproach. (2) A five month moving average. (3) A weighted average using .60 for August, .30 for July, and .10 for June. (4) Exponential smoothing with a smoothing constant equal to .20,...
National Scan, Inc., sells radio frequency inventory tags. Monthly sales for a seven-month period were as...
National Scan, Inc., sells radio frequency inventory tags. Monthly sales for a seven-month period were as follows: MonthSales(000)UnitsFeb.15Mar.18Apr.12May.20Jun.23Ju1.23Aug -27b. Forecast September sales volume using each of the following: (1)A linear trend equation.(2) A five-month moving average. (3) Exponential smoothing with a smoothing constant equal to .25, assuming a March forecast of 17(000).(4) The naive approach. (5) A weighted average using.55 for August, .10 for July, and .35 for June.
The monthly sales for Yazici Batteries, Inc. were as follows: Month Jan 20 Feb 21 Mar...
 The monthly sales for Yazici Batteries, Inc. were as follows: Month Jan 20 Feb 21 Mar 16 Apr May 15 13 Jun 18 Jul 15 Aug Sept Oct Nov Dec 18 19 22 202 This exercise contains only parts de b) The forecast for the next month (Jan) using the naive method = 24 sales (round your response to a whole number) The forecast for the next period (Jan) using a 3-month moving average approach = 22 sales (round your...
1. National Scan, Inc sells radio frequency inventory tags. Monthly sales for a seven-month period were as follows:
1. National Scan, Inc sells radio frequency inventory tags. Monthly sales for a seven-month period were as follows: Month Sales (000 units) Feb. 21 Mar. 20 Apr. 17 May 22 Jun. 20 Aug. 22 a. Plot the monthly data on a sheet of graph paper.b. Forecast September sales volume using each of the following: (1) The naive approach (2) A five month moving average (3) A weighted average using 60 for August, 30 for July, and. 10 for June (4) Exponential smoothing with a smoothing constant equal to.20, assuming a March-forecast of...
The monthly sales for Yazici Batteries, Inc., were as follows: Jan Month Feb Mar Apr May...
 The monthly sales for Yazici Batteries, Inc., were as follows: Jan Month Feb Mar Apr May Jun Jul Aug Sept Oct Nov Dec 24 Sales 19 23 16 15 13 15 17 18 22 21 23 This exercise contains only parts b and c. b) The forecast for the next month (Jan) using the naive method 24 sales (round your response to a whole number) The forecast for the next period (Jan) using a 3-month moving average approach 22.67sales (round...
The monthly sales for Yazici Batteries, Inc., were as follows:
The monthly sales for Yazici Batteries, Inc., were as follows: Month Jan Feb Mar Apr May Jun Jul Aug Sept Oct Nov DecSales 19 21 17 14 11 18 16 19 20 20 23 23b) The forecast for the next month (Jan) using the naive method (round your response to a whole number)The forecast for the next period (Jan) using a 3-month moving average approach =(round your response to two decimal places)The forecast for the next period (Jan) using a 6-month weighted average with weights ofandwhere the heaviest weights are applied to the most recent month = (round your response to one decimalplace)Using...
National Scan, Inc., sells radio frequency inventory tags. Monthly sales for a seven-month period were as...
National Scan, Inc., sells radio frequency inventory tags. Monthly sales for a seven-month period were as follows: Month Sales (000)Units Feb. 17 Mar. 20 Apr. 14 May. 22 Jun. 21 Jul. 25 Aug. 29 b. Forecast September sales volume using each of the following: (1) A linear trend equation.(Round your intermediate calculations and final answer to 2 decimal places.) Yt _ thousands (2) A five-month moving average. (Round your answer to 2 decimal places.) Moving average _ thousands...
 QUESTION 38 Monthly income, in thousands of dollars (SK), at the Acme Law Firm for the six-month period from October to March is listed in the table below. month income, $K Oct 69.3 Nov 68.6 Dec 69.4 Jan 71.7 Feb 72.3 Mar 74.8 According to the regression analysis performed for part 41. what is the numerical value of the strength of the linear association between monthly income and month number Round to four (4) decimal places) 0.3587 0.36 1.16 0.1413...
 QUESTION 38 Monthly income, in thousands of dollars (5K), at the Acme Law Firm for the six-month period from October to March is listed in the table below. month income, $K Oct 69.3 Nov 68.6 Dec 69.4 Jan 71.7 Feb 72.3 Mar 74.8 Using the data in the table, what is the naive forecast of monthly income for April (Round to two [2] decimal places.) O $74.80K 572.93K 573.55 $75.11K O 570.28K QUESTION 39 Using the data in the table...
 Question 1: The monthly sales for Telco Batteries, Inc. in a given year were as follows: Month Jan Feb Mar Apr May June July Aug Sep Oct Demand 46 47 50 49 50 48 51 49 52 53 Nov. Dec. 52 54 C. Forecast next year January sales using the following methods: I. Linear regression (You can use excel to get slope and intercept) ii. Trend adjusted exponential smoothing model. Use a = 0.2, B = 0.3, for the month...
 The monthly sales for Yazici Batteries, Inc. were as follows: Month Jan 20 Feb 21 Mar 16 Apr May 15 13 Jun 18 Jul 15 Aug Sept Oct Nov Dec 18 19 22 202 This exercise contains only parts de b) The forecast for the next month (Jan) using the naive method = 24 sales (round your response to a whole number) The forecast for the next period (Jan) using a 3-month moving average approach = 22 sales (round your...
 The monthly sales for Yazici Batteries, Inc., were as follows: Jan Month Feb Mar Apr May Jun Jul Aug Sept Oct Nov Dec 24 Sales 19 23 16 15 13 15 17 18 22 21 23 This exercise contains only parts b and c. b) The forecast for the next month (Jan) using the naive method 24 sales (round your response to a whole number) The forecast for the next period (Jan) using a 3-month moving average approach 22.67sales (round...
Most questions answered within 3 hours.
-
SoleMate’s Burkins sneakers cost $40 per pair from the supplier
and are sold by SoleMate at...
asked 43 seconds ago -
The movie Moneyball (based on the book by Michael
Lewis) tells the story of Billy Beane,...
asked 7 seconds from now -
A regional highway uses 8 tollbooths that are open to all
vehicles. A chi-square goodness-of-fit test...
asked 3 minutes ago -
In her Semiannual Monetary Policy Report to Congress on July 13,
2017, then Federal Reserve Chair...
asked 2 minutes ago -
Suppose N packets are sent,
and each packet arrives at rate of L/2R to a link....
asked 21 minutes ago -
17. Show the steps involved in reduction of the ketone in fatty
acid synthesis. Which cofactor...
asked 22 minutes ago -
5.61 g of octane, C8H18, reacts with excess oxygen in a bomb
calorimeter. The heat capacity...
asked 26 minutes ago -
The velocity field of a flow is given by V = (2+1) x
y2 i +...
asked 35 minutes ago -
(EPS with
Convertible Bonds) On June 1, 2012, Bluhm Company and
Amanar Company merged to form...
asked 33 minutes ago -
2. Discuss why the study exemplifies one that agrees with The
American Psychological Association’s (APA) Ethical...
asked 37 minutes ago -
Without considering the following capital gains and losses,
Charlene, who is single, has a taxable income...
asked 44 minutes ago -
1a. The __________ functional group often triggers our sense of
smell.
1b. The geometry around a...
asked 57 minutes ago