
Homework Answers
Add Answer to:
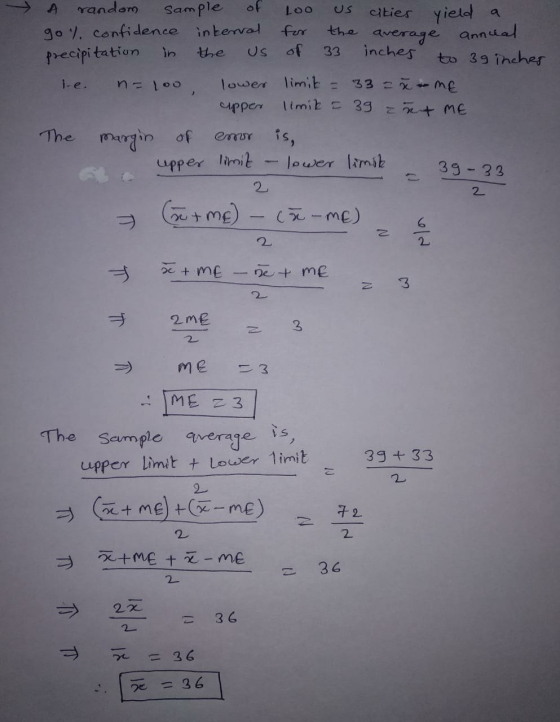
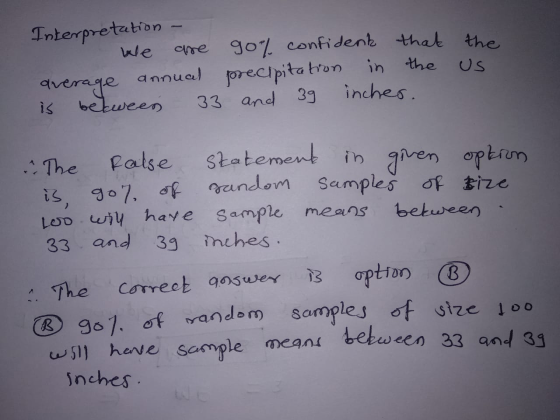
A random sample of 100 US cities yields a 90% confidence interval for the average annual...
100 random samples were taken, and for each random sample we made a 95% confidence interval,...
100 random samples were taken, and for each random sample we made a 95% confidence interval, about how many of those 100 confidence intervals would actually contain the parameter? Increasing the confidence level (more than one) a increase the width of a confidence interval b increase the probability that the parameter is in the confidence interval c increase the percentage of samples which will create a confidence interval that contains the parameter d Increase the margin of error A...
A 90% confidence interval means that with a large number of repeated random samples, 90% of...
A 90% confidence interval means that with a large number of repeated random samples, 90% of such calculated confidence intervals would include the true value of the parameter. true or false?
The roundtrip airfare between two cities is normally distributed. A random sample of 16 flights has...
The roundtrip airfare between two cities is normally distributed. A random sample of 16 flights has an average airfare of $422.10 with a standard deviation of $56.30. a. Find the standard error of the sample mean. b. What is the critical value for the 90% confidence interval for the mean airfare? c. What is the margin of error for a 90% confidence interval for the mean airfare? d. What is the 90% confidence interval for the mean airfare? e. Interpret...
19. When calculating a confidence interval, keeping the sample size the same but decreasing the confidence level, will a. decrease the width of the confidence interval b. decrease the margin of error...
 19. When calculating a confidence interval, keeping the sample size the same but decreasing the confidence level, will a. decrease the width of the confidence interval b. decrease the margin of error c. make us less sure that our confidence interval contains the true parameter d. all of the above 20. A research company polled a random sample of 799 U.S. teens about internet use.0.49 of those teens reported that they had misrepresented their age online to gain access to...
A random sample of community college students was asked the number of hours they sleep on...
 A random sample of community college students was asked the number of hours they sleep on a typical week-night during a given academic term. The sample data are as follows: 8 6 4 5 3 7 S 4 3 4 4 5 6 8 7 7 7 3 3 4 What is the 90% confidence interval estimate for the true mean amount of sleep time per night spent by community college students during a academic term? a) The data give...
Oubled to 10.4 and the level of confidence 0J 0011at would be the new margin of...
 Oubled to 10.4 and the level of confidence 0J 0011at would be the new margin of error and confidence interval? Margin of error, E o 0.90-1.645 11645X10.4/T0.7 Did the confidence interval increase or decrease and why? Confidence Interval: 2089< u< 2H.32 24.10 4. Definition of Confidence Intervals (Section 6.1) Circle your answer, True of False. A 99% confidence interval means that there is a 99% probability that the population mean, u, is in the interval. True / False A 90%...
3 Construct a 90% confidence interval for the following random sample of Lucas Barrett's golf scores...
 3 Construct a 90% confidence interval for the following random sample of Lucas Barrett's golf scores for a particular golf course he played so that he can figure out his true (population) aver 95 92 95 99 92 84 95 94 95 86 (hint: Use T-distribution table. Formula Interval estimate of a population mean when stan age score for the dared deviation is unknown) 4 The auto industry relies heavily on 0% financing to entice customers to purchase cars. In...
Narrative: Classes 1 and 2 Suppose a 95% confidence interval for between Class 1 and Class...
 Narrative: Classes 1 and 2 Suppose a 95% confidence interval for between Class 1 and Class 2 (in that These results were based on independent sample class. confidence interval for the difference in test scores nd Class 2 (in that order) is the following: 9+/- 2. ependent samples of size 100 from each 17. Classes 1 and 2 narrative) What can you conci ou are confident that the averages for Class 1 and Class 2 are significantly different b. You...
data collected by child development scientists produced the following 90% confidence interval for the average age...
data collected by child development scientists produced the following 90% confidence interval for the average age (in months) at which children say their first word: 10.4 < u < 13.8. in this example, what does the phrase 90% confident mean? a) there is a 90% chance that the sample mean is between 10.4 and 13.8 months. b) if many samples are drawn, the computed confidence intervals will contain the population mean approximately 90% of the time. c) there is 90%...
Basic Computation: Confidence Interval for My – M2 Consider two inde- pendent normal distributions. A random...
 Basic Computation: Confidence Interval for My – M2 Consider two inde- pendent normal distributions. A random sample of size n = 20 from the fire distribution showed x = 12 and a random sample of size n2 = 25 from the second distribution showed X2 = 14. We were unable to transcribe this image(a) Check Requirements If o, and on are known, what distribution does 1 - X, follow? Explain. (b) Given o = 3 and 0 2 = 4,...
 19. When calculating a confidence interval, keeping the sample size the same but decreasing the confidence level, will a. decrease the width of the confidence interval b. decrease the margin of error c. make us less sure that our confidence interval contains the true parameter d. all of the above 20. A research company polled a random sample of 799 U.S. teens about internet use.0.49 of those teens reported that they had misrepresented their age online to gain access to...
 A random sample of community college students was asked the number of hours they sleep on a typical week-night during a given academic term. The sample data are as follows: 8 6 4 5 3 7 S 4 3 4 4 5 6 8 7 7 7 3 3 4 What is the 90% confidence interval estimate for the true mean amount of sleep time per night spent by community college students during a academic term? a) The data give...
 Oubled to 10.4 and the level of confidence 0J 0011at would be the new margin of error and confidence interval? Margin of error, E o 0.90-1.645 11645X10.4/T0.7 Did the confidence interval increase or decrease and why? Confidence Interval: 2089< u< 2H.32 24.10 4. Definition of Confidence Intervals (Section 6.1) Circle your answer, True of False. A 99% confidence interval means that there is a 99% probability that the population mean, u, is in the interval. True / False A 90%...
 3 Construct a 90% confidence interval for the following random sample of Lucas Barrett's golf scores for a particular golf course he played so that he can figure out his true (population) aver 95 92 95 99 92 84 95 94 95 86 (hint: Use T-distribution table. Formula Interval estimate of a population mean when stan age score for the dared deviation is unknown) 4 The auto industry relies heavily on 0% financing to entice customers to purchase cars. In...
 Narrative: Classes 1 and 2 Suppose a 95% confidence interval for between Class 1 and Class 2 (in that These results were based on independent sample class. confidence interval for the difference in test scores nd Class 2 (in that order) is the following: 9+/- 2. ependent samples of size 100 from each 17. Classes 1 and 2 narrative) What can you conci ou are confident that the averages for Class 1 and Class 2 are significantly different b. You...
 Basic Computation: Confidence Interval for My – M2 Consider two inde- pendent normal distributions. A random sample of size n = 20 from the fire distribution showed x = 12 and a random sample of size n2 = 25 from the second distribution showed X2 = 14. We were unable to transcribe this image(a) Check Requirements If o, and on are known, what distribution does 1 - X, follow? Explain. (b) Given o = 3 and 0 2 = 4,...
Most questions answered within 3 hours.
-
B. If compound Y has approximately the same values of solubility
in toluene as compound X,...
asked 5 minutes ago -
Oscar Inc. has inventory in Japan valued at 39,051,000 Yen one
year ago. One year ago...
asked 12 minutes ago -
4. How many input & output Key Value Pairs are passed into,
and emitted out of...
asked 16 minutes ago -
If Canada suffered from "fundamental disequilibrium," and its
government choose not to devalue its currency, a...
asked 21 minutes ago -
Why would your heart not function well if constructed of
skeletal muscle? What is the particular...
asked 24 minutes ago -
Please respond to this essay question in full essay form for
Chemistry 1102 Organic and Biochemistry:...
asked 25 minutes ago -
Determine the head loss and velocity of flow in a water supply main
of 15.0 cm...
asked 27 minutes ago -
A marketing executive who knowingly authorizes a shoddy
defective product to be brought to market is...
asked 36 minutes ago -
Write a psudocode:
1. Define a function called authorize that takes in 2 strings,
uName, and...
asked 40 minutes ago -
What Hall voltage (in mV) is produced by a 0.180 T field applied
across a 2.60...
asked 39 minutes ago -
What mass of ethylene glycol (C2H6O2) must be added to 211.0 g
of water to obtain...
asked 42 minutes ago -
Mary's employer has a defined benefits retirement plan, which
pay 3.2% of her last year's salary...
asked 45 minutes ago