
Homework Answers
Add Answer to:
Do
a Bar Graph where the X-Variable is treatment and the Y-Variable is
Symptoms Improvement Indicator...
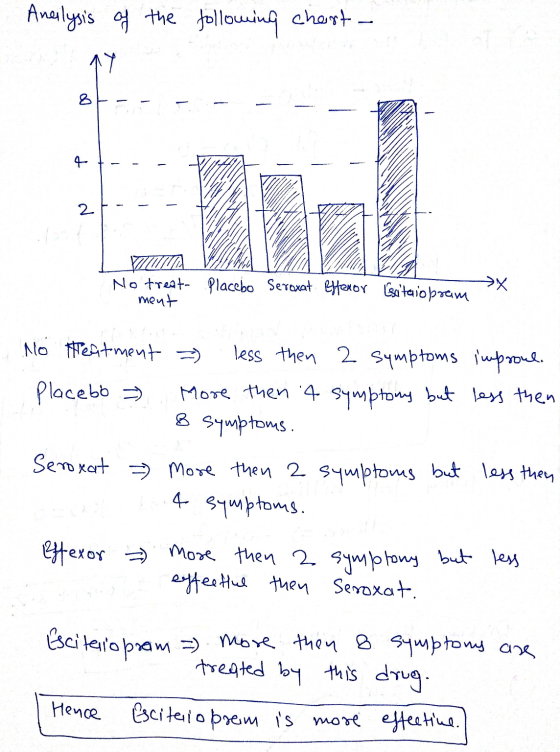
Did patients improve with no treatment or placebo? Support your statement with data from the previous...
 Did
patients improve with no treatment or placebo? Support your
statement with data from the previous analyses.
Windows nerve Page Show Zoom Window Macres SharePoint ANALYSIS OF VARIANCE Simple Bar Mean of Symptoms Improvement Indicator by Treatment Mean Symptoms Improvement Indicator No Treatment Placebo Seroxat (Paxil) Effexor Escitalopram Treatment
Did
patients improve with no treatment or placebo? Support your
statement with data from the previous analyses.
Windows nerve Page Show Zoom Window Macres SharePoint ANALYSIS OF VARIANCE Simple Bar Mean of Symptoms Improvement Indicator by Treatment Mean Symptoms Improvement Indicator No Treatment Placebo Seroxat (Paxil) Effexor Escitalopram Treatment
In the Turkey paired comparisons. What treatment shows better outcomes? Support with data of the Tuckey...
 In
the Turkey paired comparisons. What treatment shows better
outcomes? Support with data of the Tuckey analyses.
inces Mailings Review View Help Acrobat E Title Tide Tele TITLE TIE GI EDIT A Colors Fonts ISO gt F sig Document Formatting Symptoms Improvement Indicator Sum of Squares df Between Groups 251.800 Within Groups 640.700 Total 892.500 Mean Square 62.950 4 4.421 004 45 14.238 49 0.004<0.01 Table 3 Dependent Variable: Symptoms Improvement Indicator Tukey HSD Mean Difference O Treatment (J) Treatment...
In
the Turkey paired comparisons. What treatment shows better
outcomes? Support with data of the Tuckey analyses.
inces Mailings Review View Help Acrobat E Title Tide Tele TITLE TIE GI EDIT A Colors Fonts ISO gt F sig Document Formatting Symptoms Improvement Indicator Sum of Squares df Between Groups 251.800 Within Groups 640.700 Total 892.500 Mean Square 62.950 4 4.421 004 45 14.238 49 0.004<0.01 Table 3 Dependent Variable: Symptoms Improvement Indicator Tukey HSD Mean Difference O Treatment (J) Treatment...
What is the value of F Statistic for Difference? Is that significant at alpha 0.05, 0.01,...
 What is the value of F Statistic for Difference? Is that
significant at alpha 0.05, 0.01, or both? Do Post-Hoc 'Turkey' and
Options Descriptives.
I have provided the attached charts
Table 1 Symptoms Improvement Indicator 8 N Mean Std Deviation Sid. Error No Treatment 10 30 4.449 1.407 Placebo 10 4.50 2224 703 Seroxat (Paxil) 10 3.50 3.923 1.241 Effexor 10 220 4.733 1.497 Escitalopram 10 7.00 2.944 931 Total 50 3.50 4.268 604 95% Confidence interval for Mean Lower...
What is the value of F Statistic for Difference? Is that
significant at alpha 0.05, 0.01, or both? Do Post-Hoc 'Turkey' and
Options Descriptives.
I have provided the attached charts
Table 1 Symptoms Improvement Indicator 8 N Mean Std Deviation Sid. Error No Treatment 10 30 4.449 1.407 Placebo 10 4.50 2224 703 Seroxat (Paxil) 10 3.50 3.923 1.241 Effexor 10 220 4.733 1.497 Escitalopram 10 7.00 2.944 931 Total 50 3.50 4.268 604 95% Confidence interval for Mean Lower...
 Did
patients improve with no treatment or placebo? Support your
statement with data from the previous analyses.
Windows nerve Page Show Zoom Window Macres SharePoint ANALYSIS OF VARIANCE Simple Bar Mean of Symptoms Improvement Indicator by Treatment Mean Symptoms Improvement Indicator No Treatment Placebo Seroxat (Paxil) Effexor Escitalopram Treatment
Did
patients improve with no treatment or placebo? Support your
statement with data from the previous analyses.
Windows nerve Page Show Zoom Window Macres SharePoint ANALYSIS OF VARIANCE Simple Bar Mean of Symptoms Improvement Indicator by Treatment Mean Symptoms Improvement Indicator No Treatment Placebo Seroxat (Paxil) Effexor Escitalopram Treatment
 In
the Turkey paired comparisons. What treatment shows better
outcomes? Support with data of the Tuckey analyses.
inces Mailings Review View Help Acrobat E Title Tide Tele TITLE TIE GI EDIT A Colors Fonts ISO gt F sig Document Formatting Symptoms Improvement Indicator Sum of Squares df Between Groups 251.800 Within Groups 640.700 Total 892.500 Mean Square 62.950 4 4.421 004 45 14.238 49 0.004<0.01 Table 3 Dependent Variable: Symptoms Improvement Indicator Tukey HSD Mean Difference O Treatment (J) Treatment...
In
the Turkey paired comparisons. What treatment shows better
outcomes? Support with data of the Tuckey analyses.
inces Mailings Review View Help Acrobat E Title Tide Tele TITLE TIE GI EDIT A Colors Fonts ISO gt F sig Document Formatting Symptoms Improvement Indicator Sum of Squares df Between Groups 251.800 Within Groups 640.700 Total 892.500 Mean Square 62.950 4 4.421 004 45 14.238 49 0.004<0.01 Table 3 Dependent Variable: Symptoms Improvement Indicator Tukey HSD Mean Difference O Treatment (J) Treatment...
 What is the value of F Statistic for Difference? Is that
significant at alpha 0.05, 0.01, or both? Do Post-Hoc 'Turkey' and
Options Descriptives.
I have provided the attached charts
Table 1 Symptoms Improvement Indicator 8 N Mean Std Deviation Sid. Error No Treatment 10 30 4.449 1.407 Placebo 10 4.50 2224 703 Seroxat (Paxil) 10 3.50 3.923 1.241 Effexor 10 220 4.733 1.497 Escitalopram 10 7.00 2.944 931 Total 50 3.50 4.268 604 95% Confidence interval for Mean Lower...
What is the value of F Statistic for Difference? Is that
significant at alpha 0.05, 0.01, or both? Do Post-Hoc 'Turkey' and
Options Descriptives.
I have provided the attached charts
Table 1 Symptoms Improvement Indicator 8 N Mean Std Deviation Sid. Error No Treatment 10 30 4.449 1.407 Placebo 10 4.50 2224 703 Seroxat (Paxil) 10 3.50 3.923 1.241 Effexor 10 220 4.733 1.497 Escitalopram 10 7.00 2.944 931 Total 50 3.50 4.268 604 95% Confidence interval for Mean Lower...
Most questions answered within 3 hours.
-
Buckminsterfullerence is a recently allotrope of carbon in which
carbon atoms form molecules of formula C_60,...
asked 18 seconds from now -
Lower Equitorial and Upper Equitorial are the same except Lower
Equitorial has a larger capital stock....
asked 4 minutes ago -
how do you think that pH of a jar where you have added a certain
amount...
asked 14 minutes ago -
If the Federal Reserve increases the reserve requirement, what
will happen to the Money Supply in...
asked 9 minutes ago -
Suppose that market demand for a good is given by Q = 9 - 0.3 P...
asked 15 minutes ago -
two thin lenses are separated by a distance x. The first lens
has a focal length...
asked 17 minutes ago -
The computer that controls a bank's automatic teller machine
crashes a mean of 0.6 times per...
asked 20 minutes ago -
`1) How is -9 (base 10) represented in 8-bit two's complement
notation?
a) 00001001
b)11110111
c)11110110...
asked 30 minutes ago -
A 10.000 g sample of water contains 11.19% H by mass. what
should be the %H...
asked 48 minutes ago -
Consider an investment game among 2 players. Each player can
either invest,
i, or not invest,-i....
asked 45 minutes ago -
The time taken to complete a particular task is normally
distributed with a standard deviation of...
asked 55 minutes ago -
we have heteroskedasticity in a regression when:
When the variance of error terms changes when an...
asked 1 hour ago