
Homework Answers


Add Answer to:
5. Listed below are the numbers of years that popes and British monarchs (since 1690) lived...
5. Listed below are the numbers of years that popes and British monarchs (since 1690) lived...
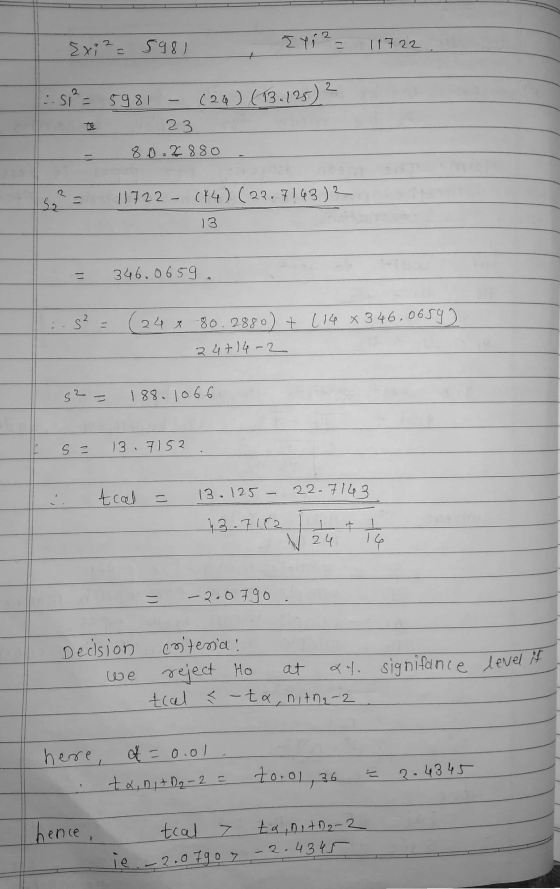
 5. Listed below are the numbers of years that popes and British monarchs (since 1690) lived after their election or coronation. Use a 0.01 significance level to test the claim that the mean longevity for popes is less than the mean for British monarchs after coronation. Do not use the p-value. Popes: 2 9 21 3 6 10 18 11 6 25 23 6 2 15 32 25 11 8 17 19 5 15 0 26 Kings and Queens: 17...
Listed below are the numbers of years that archbishops and monarchs in a certain country lived...
 Listed below are the numbers of years that archbishops and monarchs in a certain country lived after their election or coronation. Treat the values as simple random samples from larger populations. Use a 0.10 significance level to test the claim that the mean longevity for archbishops is less than the mean for monarchs after coronation. Complete parts (a) and (b) below. All measurements are in years El Click the icon to view the table of longevities of archbishops and monarchs...
as of years that archbishops and monarchs in a certain country lived after their election or...
 as of years that archbishops and monarchs in a certain country lived after their election or coronation. Assume that the two samples are om normally distributed populations. Do not assume that the population standard deviations are equal Use a 0.01 significance el tot pps is less than the mean for monarchs after coronation. All measurements are in years. me table of longevities of archbishops and monarchs. ative nypoteses? Assume that population consists of the longevity or archbishops and population consists...
Question Help sted below are the numbers of years that artists and monarchs in a certain...
 Question Help sted below are the numbers of years that artists and monarchs in a certain country lived after their election coronation Assume that the samples are independent prandom sampos sectodrom normal distributed populations Do not sure that the population standard deviations Use a 0 10 since level to test the claim that the mean longevity for as less than the mean for monarchs altercornion Almerements are in years Click the icon to view the table of ongeves of archbishops...
Listed below are the numbers of years that archionops and man y more DUUU UUUTTUI. SUT WUSS are Independent simple...
 Listed below are the numbers of years that archionops and man y more DUUU UUUTTUI. SUT WUSS are Independent simple random samples selected from normally distributed populations. Do not assume that the population standard deviations are equal. Use a 0.01 significance level to test the claim that the mean longevity for archbishops is less than the mean for monarchs after coronation. All measurements are in years. Click the icon to view the table of longevities of archbishops and monarchs. What...
A. B. Please follow the steps of hypothesis testing, including identifying the alternative and null hypothesis,...
 A.
B.
Please follow the steps of hypothesis testing, including
identifying the alternative and null hypothesis, calculating the
test statistic, finding the p-value, and making a conclusions about
the null hypothesis and a final conclusion that addresses the
original claim. Use a significance level of 0.10. Is the conclusion
affected by whether the significance level is 0.10 or 0.01?
Test Statistic=______ (Round to two decimal places)
P-Value=______ (Round to three decimal places)
Answer choices below:
a) Yes, the conclusion is...
A.
B.
Please follow the steps of hypothesis testing, including
identifying the alternative and null hypothesis, calculating the
test statistic, finding the p-value, and making a conclusions about
the null hypothesis and a final conclusion that addresses the
original claim. Use a significance level of 0.10. Is the conclusion
affected by whether the significance level is 0.10 or 0.01?
Test Statistic=______ (Round to two decimal places)
P-Value=______ (Round to three decimal places)
Answer choices below:
a) Yes, the conclusion is...
For each variable of interest – Percent Time Asleep and Longevity – create a grouped frequency...
For each variable of interest – Percent Time Asleep and Longevity – create a grouped frequency histogram. For each histogram, use a class width of 10; use a lower limit of 0 for Percent Time Asleep and 15 for Longevity. Each histogram must include an informative title, along with correct labels for both axes. For each histogram, include a paragraph that answers each of the following questions: Is the histogram symmetric, skewed to the left, or skewed to the right?...
Calculate the mean, median, and standard deviation for the total number of candies (per bag). Construct...
Calculate the mean, median, and standard deviation for the total number of candies (per bag). Construct a histogram of the total number of candies (per bag). Use the z-score method to identify any potential outliers and outliers. Assume the total number of candies is normally distributed, calculate the probability that a randomly sampled bag has at least 55 candies in a bag. If a random sample of 50 bags is selected, find the probability that the mean number of candies...
Below are a list of sequences of numbers. Your job is to program each sequence with...
Below are a list of sequences of numbers. Your job is to program each sequence with any loop of your preference (while, for, do/while). I want the code to output the sequence provided and the next number in the sequence (you can output more but there is 1 sequence that may only have 1 number after). Each sequence should be in the same main in one .cpp file. . Please order and notate each sequence in your output –. The...
Student Test Score Student Test Score Student Test Score 1 30 13 26 25 9 2...
Student Test Score Student Test Score Student Test Score 1 30 13 26 25 9 2 29 14 43 26 36 3 33 15 43 27 61 4 62 16 68 28 79 5 59 17 63 29 57 6 63 18 42 30 46 7 80 19 51 31 70 8 32 20 45 32 31 9 60 21 22 33 68 10 76 22 30 34 62 11 13 23 40 35 56 12 41 24 26 36...
 5. Listed below are the numbers of years that popes and British monarchs (since 1690) lived after their election or coronation. Use a 0.01 significance level to test the claim that the mean longevity for popes is less than the mean for British monarchs after coronation. Do not use the p-value. Popes: 2 9 21 3 6 10 18 11 6 25 23 6 2 15 32 25 11 8 17 19 5 15 0 26 Kings and Queens: 17...
 Listed below are the numbers of years that archbishops and monarchs in a certain country lived after their election or coronation. Treat the values as simple random samples from larger populations. Use a 0.10 significance level to test the claim that the mean longevity for archbishops is less than the mean for monarchs after coronation. Complete parts (a) and (b) below. All measurements are in years El Click the icon to view the table of longevities of archbishops and monarchs...
 as of years that archbishops and monarchs in a certain country lived after their election or coronation. Assume that the two samples are om normally distributed populations. Do not assume that the population standard deviations are equal Use a 0.01 significance el tot pps is less than the mean for monarchs after coronation. All measurements are in years. me table of longevities of archbishops and monarchs. ative nypoteses? Assume that population consists of the longevity or archbishops and population consists...
 Question Help sted below are the numbers of years that artists and monarchs in a certain country lived after their election coronation Assume that the samples are independent prandom sampos sectodrom normal distributed populations Do not sure that the population standard deviations Use a 0 10 since level to test the claim that the mean longevity for as less than the mean for monarchs altercornion Almerements are in years Click the icon to view the table of ongeves of archbishops...
 Listed below are the numbers of years that archionops and man y more DUUU UUUTTUI. SUT WUSS are Independent simple random samples selected from normally distributed populations. Do not assume that the population standard deviations are equal. Use a 0.01 significance level to test the claim that the mean longevity for archbishops is less than the mean for monarchs after coronation. All measurements are in years. Click the icon to view the table of longevities of archbishops and monarchs. What...
 A.
B.
Please follow the steps of hypothesis testing, including
identifying the alternative and null hypothesis, calculating the
test statistic, finding the p-value, and making a conclusions about
the null hypothesis and a final conclusion that addresses the
original claim. Use a significance level of 0.10. Is the conclusion
affected by whether the significance level is 0.10 or 0.01?
Test Statistic=______ (Round to two decimal places)
P-Value=______ (Round to three decimal places)
Answer choices below:
a) Yes, the conclusion is...
A.
B.
Please follow the steps of hypothesis testing, including
identifying the alternative and null hypothesis, calculating the
test statistic, finding the p-value, and making a conclusions about
the null hypothesis and a final conclusion that addresses the
original claim. Use a significance level of 0.10. Is the conclusion
affected by whether the significance level is 0.10 or 0.01?
Test Statistic=______ (Round to two decimal places)
P-Value=______ (Round to three decimal places)
Answer choices below:
a) Yes, the conclusion is...
Most questions answered within 3 hours.
-
How can we identify what the horizontal force is when looking at
a merry go round?...
asked 6 minutes ago -
While Dime Community Bank is based in Brooklyn; management has
decided to focus its lending activity...
asked 31 minutes ago -
1) Earnings functions, whereby the log of earnings is regressed
on years of education, years of...
asked 5 minutes ago -
Bruno Corporation is involved in the business of injection
molding of plastics. It is considering the...
asked 10 minutes ago -
What would be the vapor pressure of water at 96°C above a
solution made by dissolving...
asked 25 minutes ago -
Hydration of norbornene
Write the reaction. Discuss the intermediate. Explain how the
equilibrium in the reaction...
asked 33 minutes ago -
Suppose that a party wanted to enter an FRA that expires in 42
days and is...
asked 33 minutes ago -
ABC Ltd. estimated that a new store requires an initial
investment of $800,000. This new store...
asked 34 minutes ago -
1. Review the Nike’s marketing strategy. You must include the
company’s target market, possible market segmentation,...
asked 46 minutes ago -
One of the major advantages of ______________ is to enhance
security for private networks by keeping...
asked 52 minutes ago -
Book:
Title: Framework for
Marketing Management, 15th edition
Author/s: Philip T.
Kotler, Kevin Lane Keller
1....
asked 1 hour ago -
Given Uber’s recent corporate turbulence and ongoing
initiatives, provide a holistic situational analysis of the
environment...
asked 1 hour ago