The number of contaminating particles on a silicon wafer prior to a certain rinsing process was...
The number of contaminating particles on a silicon wafer prior to a certain rinsing process was determined for each wafer in a sample of size 100, resulting in the following frequencies:
| Number of particles | 0 | 1 | 2 | 3 | 4 | 5 | 6 | 7 | 8 | 9 | 10 | 11 | 12 | 13 | 14 |
| Frequency | 1 | 3 | 3 | 12 | 11 | 15 | 16 | 10 | 12 | 4 | 5 | 3 | 2 | 2 | 1 |
(a) What proportion of the sampled wafers had at least one particle? At least five particles? (Round your answers to two decimal places.)
| at least one particle | |
| at least five particles |
(b) What proportion of the sampled wafers had between five and ten
particles, inclusive? Strictly between five and ten particles?
(Round your answers to two decimal places.)
| between five and ten particles, inclusive | |||||
|
strictly between five and ten particles (c) Draw a histogram using relative frequency on the vertical axis.
How would you describe the shape of the histogram? The histogram is fairly symmetric and bimodal. The histogram is negatively skewed and bimodal. The histogram is negatively skewed and unimodal. The histogram is fairly symmetric and unimodal. The histogram is positively skewed and unimodal. The histogram is positively skewed and bimodal.
|


Homework Answers
A frequency distribution is a table that displays the frequency of various outcomes in a sample. Each entry in the table contains the frequency or count of the occurrences of values within a particular group or interval that summarizes the distribution of values in the sample.
Histogram is used to represent the univariate dataset graphically. Frequency distribution is a representation, either in a graphical or tabular format that displays the number of observations within a given interval.
Frequency distribution is a representation, either in a graphical or tabular format that displays the number of observations within a given interval. The intervals must be mutually exclusive and exhaustive, and the interval size depends on the data being analysed and the goals of the analyst.
The Histogram consist rectangles, whose area is proportional to frequency of a value and whose width is equal to the class interval.
The probabilities for contaminating particles on a silicon wafer prior to a certain rinsing process were determined as follows:
Number of particles | Frequency (X) | Probability p(x) |
0 | 1 | 0.01 |
1 | 3 | 0.03 |
2 | 3 | 0.03 |
3 | 12 | 0.12 |
4 | 11 | 0.11 |
5 | 15 | 0.15 |
6 | 16 | 0.16 |
7 | 10 | 0.10 |
8 | 12 | 0.12 |
9 | 4 | 0.04 |
10 | 5 | 0.05 |
11 | 3 | 0.03 |
12 | 2 | 0.02 |
13 | 2 | 0.02 |
14 | 1 | 0.01 |
Total | 100 | 1.00 |
(a.1)
The proportion of sampled wafers that had at least one particle is,

(a.2)
The proportion of sampled wafers that had at least five particles is,
![P(X 25) =1- P(X<5)
P(X =0)+P(X = 1)+P(X = 2)]
=1-
| +P( X = 3)+P( X = 4)
=1-0.01+0.03+0.03+0.12 +0.11
= 1-0.30
= 0.70](http://img.homeworklib.com/questions/d3ed6370-240c-11eb-bc39-ef022ab984ba.png?x-oss-process=image/resize,w_560)
(b.1)
The proportion of the sampled wafers had between five and ten particles, inclusive is,

(b.2)
The proportion of the sampled wafers had strictly between five and ten particles is,

(c)
The histogram using relative frequency on the vertical axis is,
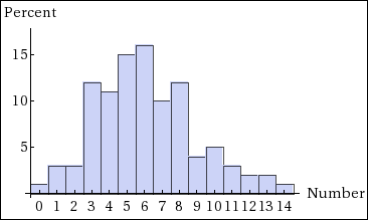
The shape of the histogram is fairly symmetric and unimodal.
Ans: Part a.1The proportion of sampled wafers that had at least one particle is 0.99.
Part a.2The proportion of sampled wafers that had at least five particles is 0.70.
Part b.1The proportion of the sampled wafers had between five and ten particles, inclusive is 0.62.
Part b.2The proportion of the sampled wafers had strictly between five and ten particles is 0.42.
Part cThe histogram using relative frequency is,
The histogram is fairly symmetric and unimodal.
Add Answer to:
The number of contaminating particles on a silicon wafer prior
to a certain rinsing process was...
The number of contaminating particles on a silicon wafer prior a certain rinsing process was determined...
 The number of contaminating particles on a silicon wafer prior a certain rinsing process was determined for each wafer in a sample f size 100, resulting in the following frequencies: 03 12 11 15 16 10 12 1011 Fre ro particles (a) What proportion of the sampled wafers had least one particle? At least five particles? (Round your answers to two dedimal places.) t least one particle t least five particles (b) What proportion between five and ten particles, inclusive...
Will rate!! The number of contaminating particles on a silicon wafer prior to a certain rinsing...
 Will rate!!
The number of contaminating particles on a silicon wafer prior to a certain rinsing process was determined for each wafer in a sample of size 100, resulting in the following frequencies Number of particles Frequency 1 2 3 4 5 6 7 8 9 1011 12 13 14 1 3 3 12 11 15 19 10104 2 Draw a histogram using relative frequency on the vertical axis Percent Percent 15 10 Number 01234567 8 9 10111213 14 :İİI!!!.10:12...
Will rate!!
The number of contaminating particles on a silicon wafer prior to a certain rinsing process was determined for each wafer in a sample of size 100, resulting in the following frequencies Number of particles Frequency 1 2 3 4 5 6 7 8 9 1011 12 13 14 1 3 3 12 11 15 19 10104 2 Draw a histogram using relative frequency on the vertical axis Percent Percent 15 10 Number 01234567 8 9 10111213 14 :İİI!!!.10:12...
I need help please The accompanying summary data on Ceo, particle sizes (nm) under certain experimental conditions w...
 I need help please
The accompanying summary data on Ceo, particle sizes (nm) under certain experimental conditions was read from a graph in an article. 3.0-<3.5 3.5-c4.0 4.0-c4.5 4.5-<5.0 S0-5.5 21 15 23 34 5.5-c6.0 6.0-c6.5 6.5-<7.0 7.0-<7.5 7.5-<8.0 13 (a) what proportion of the observations are less than 57 (Round your answer to three decimal places.) (b) What proportion of the observations are at least 67 (Round your answer to three decimal places ) (s) Construct a histogram with...
I need help please
The accompanying summary data on Ceo, particle sizes (nm) under certain experimental conditions was read from a graph in an article. 3.0-<3.5 3.5-c4.0 4.0-c4.5 4.5-<5.0 S0-5.5 21 15 23 34 5.5-c6.0 6.0-c6.5 6.5-<7.0 7.0-<7.5 7.5-<8.0 13 (a) what proportion of the observations are less than 57 (Round your answer to three decimal places.) (b) What proportion of the observations are at least 67 (Round your answer to three decimal places ) (s) Construct a histogram with...
Unit 6 Lesson 3 Classwork (Adapted from Math Vision Project) Data Distribution A lot of information...
 Unit 6 Lesson 3 Classwork (Adapted from Math Vision Project) Data Distribution A lot of information can be obtained from looking at data plots and their distributions. It is important when describing data that we use context to communicate the shape, center, and spread. Shape and spread: Modes: uniform (evenly spread- no obvious mode), unimodal (one main peak), bimodal (two main peaks), or multimodal (multiple locations where the data is relatively higher than others). Skewed distribution: when most data is...
2) Populations versus samples. For each statement, answer with either population, sample, or both. A) The compl...
 2) Populations versus samples. For each statement, answer with either population, sample, or both. A) The complete set of information. B) A portion, not all, of the information. C) Has the potential to be biased or misleading. D) Measured or summarized with parameters. E) Measured or summarized with statistics. 3) Descriptive versus inferential statistics. For each statement, answer with either descriptive or inferential statistics. A) Facts about samples. B) Educated guesses about populations based on samples. C) The world population...
 The number of contaminating particles on a silicon wafer prior a certain rinsing process was determined for each wafer in a sample f size 100, resulting in the following frequencies: 03 12 11 15 16 10 12 1011 Fre ro particles (a) What proportion of the sampled wafers had least one particle? At least five particles? (Round your answers to two dedimal places.) t least one particle t least five particles (b) What proportion between five and ten particles, inclusive...
 Will rate!!
The number of contaminating particles on a silicon wafer prior to a certain rinsing process was determined for each wafer in a sample of size 100, resulting in the following frequencies Number of particles Frequency 1 2 3 4 5 6 7 8 9 1011 12 13 14 1 3 3 12 11 15 19 10104 2 Draw a histogram using relative frequency on the vertical axis Percent Percent 15 10 Number 01234567 8 9 10111213 14 :İİI!!!.10:12...
Will rate!!
The number of contaminating particles on a silicon wafer prior to a certain rinsing process was determined for each wafer in a sample of size 100, resulting in the following frequencies Number of particles Frequency 1 2 3 4 5 6 7 8 9 1011 12 13 14 1 3 3 12 11 15 19 10104 2 Draw a histogram using relative frequency on the vertical axis Percent Percent 15 10 Number 01234567 8 9 10111213 14 :İİI!!!.10:12...
 I need help please
The accompanying summary data on Ceo, particle sizes (nm) under certain experimental conditions was read from a graph in an article. 3.0-<3.5 3.5-c4.0 4.0-c4.5 4.5-<5.0 S0-5.5 21 15 23 34 5.5-c6.0 6.0-c6.5 6.5-<7.0 7.0-<7.5 7.5-<8.0 13 (a) what proportion of the observations are less than 57 (Round your answer to three decimal places.) (b) What proportion of the observations are at least 67 (Round your answer to three decimal places ) (s) Construct a histogram with...
I need help please
The accompanying summary data on Ceo, particle sizes (nm) under certain experimental conditions was read from a graph in an article. 3.0-<3.5 3.5-c4.0 4.0-c4.5 4.5-<5.0 S0-5.5 21 15 23 34 5.5-c6.0 6.0-c6.5 6.5-<7.0 7.0-<7.5 7.5-<8.0 13 (a) what proportion of the observations are less than 57 (Round your answer to three decimal places.) (b) What proportion of the observations are at least 67 (Round your answer to three decimal places ) (s) Construct a histogram with...
 Unit 6 Lesson 3 Classwork (Adapted from Math Vision Project) Data Distribution A lot of information can be obtained from looking at data plots and their distributions. It is important when describing data that we use context to communicate the shape, center, and spread. Shape and spread: Modes: uniform (evenly spread- no obvious mode), unimodal (one main peak), bimodal (two main peaks), or multimodal (multiple locations where the data is relatively higher than others). Skewed distribution: when most data is...
 2) Populations versus samples. For each statement, answer with either population, sample, or both. A) The complete set of information. B) A portion, not all, of the information. C) Has the potential to be biased or misleading. D) Measured or summarized with parameters. E) Measured or summarized with statistics. 3) Descriptive versus inferential statistics. For each statement, answer with either descriptive or inferential statistics. A) Facts about samples. B) Educated guesses about populations based on samples. C) The world population...
Most questions answered within 3 hours.
-
The reach and involvement of the federal government, in terms of
its role in disaster relief,...
asked 39 seconds ago -
Problem: The equilibrium constant, Keq, is 5 x 10^-11 m HCO3
<-----------> H^+ + CO3^-2 Calculate...
asked 7 minutes ago -
Explain how blackbody radiation led to the idea of "quanta."
Will rate answer!
asked 13 minutes ago -
Two noble gases (Ne and He) are injected into the chambers of an
insulated container. Each...
asked 8 minutes ago -
Suppose you purchase a zero coupon bond with a face value of
$1,000, maturing in 18...
asked 13 minutes ago -
Do you believe that the $785,000 amount at the center of the
Overstock-Grant Thornton dispute was...
asked 14 minutes ago -
Find and , the mean and standard deviation of the
sampling distribution of :
μ = 25,...
asked 38 minutes ago -
According to the manufacturer of a certain candy, 9% of the
candy produced are red. If...
asked 56 minutes ago -
A Eucher Deck consists of 24 cards. In a four- player game, each
player is dealt...
asked 1 hour ago -
This is a challenging question.
The titration of an impure sample of KHP found that 36.00...
asked 1 hour ago -
1. Starting from rest, an automatic subway train is controlled
by a computer
that causes it’s...
asked 38 minutes ago -
You place a block of
ice (mass of 3 kg) into a test chamber filled with...
asked 1 hour ago