

Homework Answers
| Number of particles | Frequency |
| 0 | 1 |
| 1 | 3 |
| 2 | 3 |
| 3 | 12 |
| 4 | 11 |
| 5 | 15 |
| 6 | 19 |
| 7 | 10 |
| 8 | 10 |
| 9 | 4 |
| 10 | 5 |
| 11 | 3 |
| 12 | 1 |
| 13 | 2 |
| 14 | 1 |
Correct option "C"
Correct option "A"
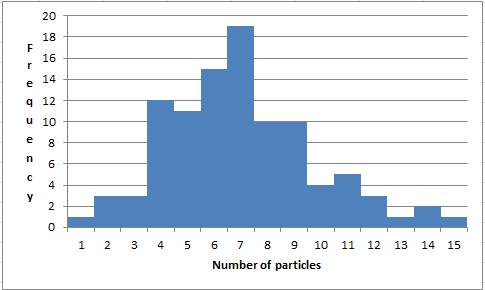
The histogram is fairly symmetric and bimodal.
Add Answer to:
Will rate!!
The number of contaminating particles on a silicon wafer prior to a certain rinsing...
The number of contaminating particles on a silicon wafer prior a certain rinsing process was determined...
 The number of contaminating particles on a silicon wafer prior a certain rinsing process was determined for each wafer in a sample f size 100, resulting in the following frequencies: 03 12 11 15 16 10 12 1011 Fre ro particles (a) What proportion of the sampled wafers had least one particle? At least five particles? (Round your answers to two dedimal places.) t least one particle t least five particles (b) What proportion between five and ten particles, inclusive...
The number of contaminating particles on a silicon wafer prior to a certain rinsing process was...
 The number of contaminating particles on a silicon wafer prior
to a certain rinsing process was determined for each wafer in a
sample of size 100, resulting in the following frequencies:
Number of particles
0
1
2
3
4
5
6
7
8
9
10
11
12
13
14
Frequency
1
3
3
12
11
15
16
10
12
4
5
3
2
2
1
(a) What proportion of the sampled wafers had at least one
particle? At least...
The number of contaminating particles on a silicon wafer prior
to a certain rinsing process was determined for each wafer in a
sample of size 100, resulting in the following frequencies:
Number of particles
0
1
2
3
4
5
6
7
8
9
10
11
12
13
14
Frequency
1
3
3
12
11
15
16
10
12
4
5
3
2
2
1
(a) What proportion of the sampled wafers had at least one
particle? At least...
The Cambridge Study in Delinquent Development was undertaken in north London (U.K.) to investigate the links...
 The Cambridge Study in Delinquent Development was undertaken in north London (U.K.) to investigate the links between criminal behavior in young men and the socioeconomic factors of their upbringing (Farrington 1994). A cohort of 395 boys was followed for about 20 years, starting at the age of 8 or 9. All of the boys attended six schools located near the research office. The following table shows the total number of criminal convictions by the boys between the start and end...
Professor Hill in the music department kept a list of the number of students visiting his...
Professor Hill in the music department kept a list of the number of students visiting his office each week. Results for the past 34 weeks are shown below: 15 23 17 13 3 9 7 6 8 11 16 32 27 4 20 3 28 5 6 11 20 12 8 10 25 10 8 15 11 9 14 9 22 22. c. Draw/make a histogram with five classes. d. Identify the basic distribution shape as a mound-shaped symmetric, skewed...
I need help please The accompanying summary data on Ceo, particle sizes (nm) under certain experimental conditions w...
 I need help please
The accompanying summary data on Ceo, particle sizes (nm) under certain experimental conditions was read from a graph in an article. 3.0-<3.5 3.5-c4.0 4.0-c4.5 4.5-<5.0 S0-5.5 21 15 23 34 5.5-c6.0 6.0-c6.5 6.5-<7.0 7.0-<7.5 7.5-<8.0 13 (a) what proportion of the observations are less than 57 (Round your answer to three decimal places.) (b) What proportion of the observations are at least 67 (Round your answer to three decimal places ) (s) Construct a histogram with...
I need help please
The accompanying summary data on Ceo, particle sizes (nm) under certain experimental conditions was read from a graph in an article. 3.0-<3.5 3.5-c4.0 4.0-c4.5 4.5-<5.0 S0-5.5 21 15 23 34 5.5-c6.0 6.0-c6.5 6.5-<7.0 7.0-<7.5 7.5-<8.0 13 (a) what proportion of the observations are less than 57 (Round your answer to three decimal places.) (b) What proportion of the observations are at least 67 (Round your answer to three decimal places ) (s) Construct a histogram with...
Internet radio: The following table presents the number of hours a sample of 40 subscribers listened...
 Internet radio: The following table presents the number of hours a sample of 40 subscribers listened to Pandora Radio in a given week. 52 113 4 12 9 16 10 37 15 18 8 23 4 3 17 19 12 20 14 10 37 21 36 17 3 23 28 19 20 29 12 a. Construct a frequency distribution with approximately eleven classes b. Construct a frequency histogram from this frequency distribution. c. Construct a relative frequency distribution for the...
Unit 6 Lesson 3 Classwork (Adapted from Math Vision Project) Data Distribution A lot of information...
 Unit 6 Lesson 3 Classwork (Adapted from Math Vision Project) Data Distribution A lot of information can be obtained from looking at data plots and their distributions. It is important when describing data that we use context to communicate the shape, center, and spread. Shape and spread: Modes: uniform (evenly spread- no obvious mode), unimodal (one main peak), bimodal (two main peaks), or multimodal (multiple locations where the data is relatively higher than others). Skewed distribution: when most data is...
55 The data to the right represent the number of customers waiting for a table at...
 55 The data to the right represent the number of customers waiting for a table at 6:00 PM for 40 consecutive Saturdays at Bobak's Restaurant. Complete parts (a) through (h) below. 8 13 9 13 9 9 10 12 12 11 6 5 7 11 6 6 8 3 6 10 10 4 7 8 5 6 9 9 5 9 5 5 8 9 9 10 8 12 8 (a) Are these data discrete or continuous? Explain. O A....
A company tested 11 random brands of vanilla yogurt and found the number of calories per...
 A company tested 11 random brands of vanilla yogurt and found the number of calories per serving given below. Complete parts a through c below. 124 168 160 121 118 111 177 156 102 102 139 91 D a) Plot the data. Use the plots to check the assumptions and conditions for inference Choose the correct histogram below. ОА, OB Oc. OD 5- 3- kouerber ਦੇ ਨ · 2 80 120 160 200 Caliper Serving 80 120 180 200 Calories...
please help with letters G & H and number 3 letters A-C 2. The incomplete frequency...
 please help with letters G & H and number 3 letters
A-C
2. The incomplete frequency distribution table given below represents the score of an exam in a math class. (a) (5 points) Complete the frequency distribution table below Class Class Class Cumulative Percentage Limits Boundaries Midpoint Frequency Frequency Frequency 154.5, 55 — 67 61 4 167.5 4 Class 110,000 122.50% 9 13 40.00% 68 - 80 180.5 174 81 - 93 180.s, 187 16 29 23.5 93.5 94-106 40...
please help with letters G & H and number 3 letters
A-C
2. The incomplete frequency distribution table given below represents the score of an exam in a math class. (a) (5 points) Complete the frequency distribution table below Class Class Class Cumulative Percentage Limits Boundaries Midpoint Frequency Frequency Frequency 154.5, 55 — 67 61 4 167.5 4 Class 110,000 122.50% 9 13 40.00% 68 - 80 180.5 174 81 - 93 180.s, 187 16 29 23.5 93.5 94-106 40...
 The number of contaminating particles on a silicon wafer prior a certain rinsing process was determined for each wafer in a sample f size 100, resulting in the following frequencies: 03 12 11 15 16 10 12 1011 Fre ro particles (a) What proportion of the sampled wafers had least one particle? At least five particles? (Round your answers to two dedimal places.) t least one particle t least five particles (b) What proportion between five and ten particles, inclusive...
 The number of contaminating particles on a silicon wafer prior
to a certain rinsing process was determined for each wafer in a
sample of size 100, resulting in the following frequencies:
Number of particles
0
1
2
3
4
5
6
7
8
9
10
11
12
13
14
Frequency
1
3
3
12
11
15
16
10
12
4
5
3
2
2
1
(a) What proportion of the sampled wafers had at least one
particle? At least...
The number of contaminating particles on a silicon wafer prior
to a certain rinsing process was determined for each wafer in a
sample of size 100, resulting in the following frequencies:
Number of particles
0
1
2
3
4
5
6
7
8
9
10
11
12
13
14
Frequency
1
3
3
12
11
15
16
10
12
4
5
3
2
2
1
(a) What proportion of the sampled wafers had at least one
particle? At least...
 The Cambridge Study in Delinquent Development was undertaken in north London (U.K.) to investigate the links between criminal behavior in young men and the socioeconomic factors of their upbringing (Farrington 1994). A cohort of 395 boys was followed for about 20 years, starting at the age of 8 or 9. All of the boys attended six schools located near the research office. The following table shows the total number of criminal convictions by the boys between the start and end...
 I need help please
The accompanying summary data on Ceo, particle sizes (nm) under certain experimental conditions was read from a graph in an article. 3.0-<3.5 3.5-c4.0 4.0-c4.5 4.5-<5.0 S0-5.5 21 15 23 34 5.5-c6.0 6.0-c6.5 6.5-<7.0 7.0-<7.5 7.5-<8.0 13 (a) what proportion of the observations are less than 57 (Round your answer to three decimal places.) (b) What proportion of the observations are at least 67 (Round your answer to three decimal places ) (s) Construct a histogram with...
I need help please
The accompanying summary data on Ceo, particle sizes (nm) under certain experimental conditions was read from a graph in an article. 3.0-<3.5 3.5-c4.0 4.0-c4.5 4.5-<5.0 S0-5.5 21 15 23 34 5.5-c6.0 6.0-c6.5 6.5-<7.0 7.0-<7.5 7.5-<8.0 13 (a) what proportion of the observations are less than 57 (Round your answer to three decimal places.) (b) What proportion of the observations are at least 67 (Round your answer to three decimal places ) (s) Construct a histogram with...
 Internet radio: The following table presents the number of hours a sample of 40 subscribers listened to Pandora Radio in a given week. 52 113 4 12 9 16 10 37 15 18 8 23 4 3 17 19 12 20 14 10 37 21 36 17 3 23 28 19 20 29 12 a. Construct a frequency distribution with approximately eleven classes b. Construct a frequency histogram from this frequency distribution. c. Construct a relative frequency distribution for the...
 Unit 6 Lesson 3 Classwork (Adapted from Math Vision Project) Data Distribution A lot of information can be obtained from looking at data plots and their distributions. It is important when describing data that we use context to communicate the shape, center, and spread. Shape and spread: Modes: uniform (evenly spread- no obvious mode), unimodal (one main peak), bimodal (two main peaks), or multimodal (multiple locations where the data is relatively higher than others). Skewed distribution: when most data is...
 55 The data to the right represent the number of customers waiting for a table at 6:00 PM for 40 consecutive Saturdays at Bobak's Restaurant. Complete parts (a) through (h) below. 8 13 9 13 9 9 10 12 12 11 6 5 7 11 6 6 8 3 6 10 10 4 7 8 5 6 9 9 5 9 5 5 8 9 9 10 8 12 8 (a) Are these data discrete or continuous? Explain. O A....
 A company tested 11 random brands of vanilla yogurt and found the number of calories per serving given below. Complete parts a through c below. 124 168 160 121 118 111 177 156 102 102 139 91 D a) Plot the data. Use the plots to check the assumptions and conditions for inference Choose the correct histogram below. ОА, OB Oc. OD 5- 3- kouerber ਦੇ ਨ · 2 80 120 160 200 Caliper Serving 80 120 180 200 Calories...
 please help with letters G & H and number 3 letters
A-C
2. The incomplete frequency distribution table given below represents the score of an exam in a math class. (a) (5 points) Complete the frequency distribution table below Class Class Class Cumulative Percentage Limits Boundaries Midpoint Frequency Frequency Frequency 154.5, 55 — 67 61 4 167.5 4 Class 110,000 122.50% 9 13 40.00% 68 - 80 180.5 174 81 - 93 180.s, 187 16 29 23.5 93.5 94-106 40...
please help with letters G & H and number 3 letters
A-C
2. The incomplete frequency distribution table given below represents the score of an exam in a math class. (a) (5 points) Complete the frequency distribution table below Class Class Class Cumulative Percentage Limits Boundaries Midpoint Frequency Frequency Frequency 154.5, 55 — 67 61 4 167.5 4 Class 110,000 122.50% 9 13 40.00% 68 - 80 180.5 174 81 - 93 180.s, 187 16 29 23.5 93.5 94-106 40...
Most questions answered within 3 hours.
-
Write the ionic equations for the first stage of salts
hydrolysis.
Anion, Cation?
Na2S
NiSO4
K2SO4...
asked 48 minutes ago -
suppose there is a normally distributed population with a mean of
250 and a standard deviation...
asked 1 hour ago -
Question Three
Suppose you as project manager are using the Waterfall
development methodology on a large...
asked 2 hours ago -
Which statement is not true about welfare in Canada?
A.Benefits typically vary based on one's ability...
asked 3 hours ago -
Please help me with FLOWCHART and UML diagram for class,
thank you!
#include <iostream>
#include <fstream>...
asked 3 hours ago -
3. Describe the “logic circuit” of the Lac operon. Which
proteins are bound or not to...
asked 3 hours ago -
Ayesha’s adjusted gross income is $60,000 in 2019. She donated a
piece of artwork with a...
asked 3 hours ago -
For Dijkstra’s shortest path algorithm:
a. Give the Big-O time for Dijkstra’s shortest path algorithm
and...
asked 4 hours ago -
Phosphorus violates the 'octet rule' in biological molecules,
forming more covalent bonds than expected based on...
asked 4 hours ago -
A 1.3 eV electron has a 10-4 probability of tunneling
through a 2.4 eV potential barrier....
asked 4 hours ago -
What is the one ingredient that is common to being successful
with all stakeholders?
profit
trust...
asked 4 hours ago -
Write an assembly language 32 bit program that reads in lines of
text by a .txt...
asked 4 hours ago