
Homework Answers
I think you forgot to give options for the answer, because otherwise you must provide the data for finding correlation. Anyway I give you the possible answer by some data points that shows same nature as the plots you provided. If there is any additional information please comment, I will give you answer.
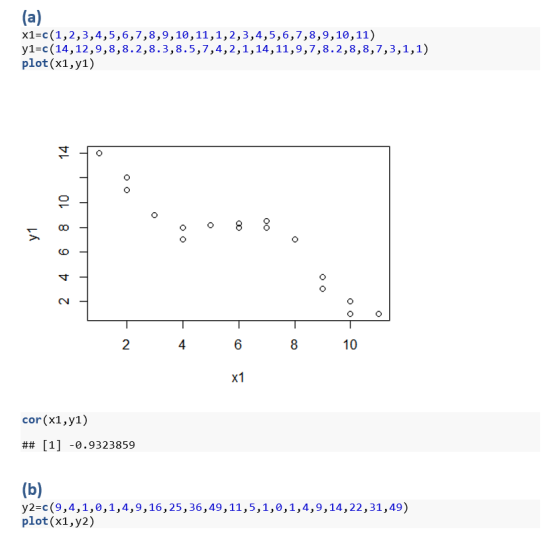
I give you answers based on the following plots, here I use R software for calculation.
a)It shows strong negative correlation. That is 0.7<correlation<1.
b)It shows moderately strong positive correlation. That is 0.5<correlation<0.8
c)It shows very strong positive correlation. That is 0.9<correlation<1.
d)It shows week positive correlation. That is 0<correlation<0.2.
e)It shows week negative correlation. That is -0.4<correlation<0
f)It shows strong negative correlation. That is -1<correlation<0.8
![50 O 40 30 y2 ܘܘ OO 20 oo 은 18 o 8 O o 0 O 2 4 6 8 10 x1 cor (x1,72) ## [1] 0.7988189 (c) y3=C(1,2,3,4,5,6,7,8,9,10,11,0,1,2,](http://img.homeworklib.com/questions/e179cb10-ee3a-11ea-944b-2dd04aab20a6.png?x-oss-process=image/resize,w_560)
![10 OO 8 co OO y3 0 0 4 2 0 0 0 2 4 6 8 10 X1 cor(x1,y3) ## [1] 0.9877296 (d) y4=C(7,6,5,4,5,6,7,8,7,6,5,5,6,5,7,4,5,6,7,6,5,6](http://img.homeworklib.com/questions/e1decfb0-ee3a-11ea-aa56-8b6d585ba1cb.png?x-oss-process=image/resize,w_560)
![00 7 O o O y4 9 O o 1 O O O O 5 O o 4 2 4 9 8 10 X1 cor(x1,74) ## [1] 0.1677051](http://img.homeworklib.com/questions/e240be90-ee3a-11ea-8f99-f5f9066f2a18.png?x-oss-process=image/resize,w_560)
Add Answer to:
1) For each of the six scatterplots, estimate the value of the correlation coefficient. rri 43...
Which one of the four scatterplots below has a correlation coefficient of 0.99? А B ....
 Which one of the four scatterplots below has a correlation coefficient of 0.99? А B . 20 40 60 80 0 20 40 60 80 0 0 20 40 60 80 100 0 20 40 60 80 100 с D 0 20 40 60 80 0 20 40 60 80 0 20 40 60 80 100 0 20 40 60 80 100 Scatterplot A Scatterplot B O Scatterplot C Scatterplot D
The correlation coefficient may assume any value between? a) 0 and 1 b) - ∞ and...
The correlation coefficient may assume any value between? a) 0 and 1 b) - ∞ and ∞ c) 0 and 8 d) -1 and 1
find the coefficient of determination, given that the value of the linear correlation coefficient, r, is...
 find the coefficient of determination, given that the value of the
linear correlation coefficient, r, is -0.451
D Question 8 1 pts Find the coefficient of determination, given that the value of the linear correlation coefficient, r, is -0.451. O 0.451 O 0.797 O 0.549 O 0.203
find the coefficient of determination, given that the value of the
linear correlation coefficient, r, is -0.451
D Question 8 1 pts Find the coefficient of determination, given that the value of the linear correlation coefficient, r, is -0.451. O 0.451 O 0.797 O 0.549 O 0.203
If the correlation coefficient value for the two variables is 0.865 with sample size 15 each....
 If the correlation coefficient value for the two variables is 0.865 with sample size 15 each. What is the value of the test statistic, to test the significance of the correlation? a) b) 4.221 5.221 6.216 7.221
This question asks you to compute the sample correlation coefficient (?xy ) and estimate the regression...
This question asks you to compute the sample correlation coefficient (?xy ) and estimate the regression coefficients with ordinary least squares (OLS) “by hand” for the model (Yi = ?1 + ?2Xi +ui) using the data below, but without using R (except to get critical values or p‐values, and to check your work) y x 1 2 5 6 4 4 4 6 1 2 A. Compute and report the sample correlation coefficient B. Can you reject the null hypothesis...
4 Scatterplots Match these values of r with the five scatterplots shown here and the next page: 0...
 4 Scatterplots Match these values of r with the five scatterplots shown here and the next page: 0.268, 0992.-1, 0.746, and 1 . on y 14 12 00 a1 02 30405 0.6 0.7 0.8 0.9 OS 0.6 07 Graphs in Statistical A plore! Exercises 9 and 10 provide two data sets from " by E J. Anscombe, The American Statistician, Vol. 27. For each exercise a. Construct a scatterplot b. Find the value of the linear correlation coefficient r, then...
The correlation coefficient: A, Is a number with a range from -1 to 1 B. If...
The correlation coefficient: A, Is a number with a range from -1 to 1 B. If there is no correlation, the coefficient is negative C. If the correlation coefficient is negative, it indicates a strong positive relationship between x and y D. All of the above
Please explain in detail and provide answers Linear Regression & Correlation Coefficient Practice Would you consider...
 Please explain in detail and provide answers
Linear Regression & Correlation Coefficient Practice Would you consider the data to be accurate, precise or both? Justify. 1. 10 T 2. The table below shows the percentage of females in the U.S. labor force at various times throughout history Years after 1900 | 50 Percentage | 60 T70- T80-T90 8.1 42.5 45.3 100 52.0 Enter the data into your calculator or excel and give the equation. Round slope & y-intercept to 2...
Please explain in detail and provide answers
Linear Regression & Correlation Coefficient Practice Would you consider the data to be accurate, precise or both? Justify. 1. 10 T 2. The table below shows the percentage of females in the U.S. labor force at various times throughout history Years after 1900 | 50 Percentage | 60 T70- T80-T90 8.1 42.5 45.3 100 52.0 Enter the data into your calculator or excel and give the equation. Round slope & y-intercept to 2...
17. Explain how you found the linear correlation coefficient. Find the value of the linear correlation...
 17. Explain how you found the linear correlation
coefficient.
Find the value of the linear correlation coefficient r. Points: 5 17) The paired data below consist of the test scores of 6 randomly selected students and the number of hours they studied for the test. Hours 5 10 4 6 10 9 Score 64 86 69 86 59 87 D) 0.224 C) 0.678 B) -0.678 A) -0.224 Explain how you found the linear correlation coefficient.
17. Explain how you found the linear correlation
coefficient.
Find the value of the linear correlation coefficient r. Points: 5 17) The paired data below consist of the test scores of 6 randomly selected students and the number of hours they studied for the test. Hours 5 10 4 6 10 9 Score 64 86 69 86 59 87 D) 0.224 C) 0.678 B) -0.678 A) -0.224 Explain how you found the linear correlation coefficient.
The coefficient of determination is the value of the correlation coefficient represented by c2 A. True...
The coefficient of determination is the value of the correlation coefficient represented by c2 A. True B. False
 Which one of the four scatterplots below has a correlation coefficient of 0.99? А B . 20 40 60 80 0 20 40 60 80 0 0 20 40 60 80 100 0 20 40 60 80 100 с D 0 20 40 60 80 0 20 40 60 80 0 20 40 60 80 100 0 20 40 60 80 100 Scatterplot A Scatterplot B O Scatterplot C Scatterplot D
 find the coefficient of determination, given that the value of the
linear correlation coefficient, r, is -0.451
D Question 8 1 pts Find the coefficient of determination, given that the value of the linear correlation coefficient, r, is -0.451. O 0.451 O 0.797 O 0.549 O 0.203
find the coefficient of determination, given that the value of the
linear correlation coefficient, r, is -0.451
D Question 8 1 pts Find the coefficient of determination, given that the value of the linear correlation coefficient, r, is -0.451. O 0.451 O 0.797 O 0.549 O 0.203
 If the correlation coefficient value for the two variables is 0.865 with sample size 15 each. What is the value of the test statistic, to test the significance of the correlation? a) b) 4.221 5.221 6.216 7.221
 4 Scatterplots Match these values of r with the five scatterplots shown here and the next page: 0.268, 0992.-1, 0.746, and 1 . on y 14 12 00 a1 02 30405 0.6 0.7 0.8 0.9 OS 0.6 07 Graphs in Statistical A plore! Exercises 9 and 10 provide two data sets from " by E J. Anscombe, The American Statistician, Vol. 27. For each exercise a. Construct a scatterplot b. Find the value of the linear correlation coefficient r, then...
 Please explain in detail and provide answers
Linear Regression & Correlation Coefficient Practice Would you consider the data to be accurate, precise or both? Justify. 1. 10 T 2. The table below shows the percentage of females in the U.S. labor force at various times throughout history Years after 1900 | 50 Percentage | 60 T70- T80-T90 8.1 42.5 45.3 100 52.0 Enter the data into your calculator or excel and give the equation. Round slope & y-intercept to 2...
Please explain in detail and provide answers
Linear Regression & Correlation Coefficient Practice Would you consider the data to be accurate, precise or both? Justify. 1. 10 T 2. The table below shows the percentage of females in the U.S. labor force at various times throughout history Years after 1900 | 50 Percentage | 60 T70- T80-T90 8.1 42.5 45.3 100 52.0 Enter the data into your calculator or excel and give the equation. Round slope & y-intercept to 2...
 17. Explain how you found the linear correlation
coefficient.
Find the value of the linear correlation coefficient r. Points: 5 17) The paired data below consist of the test scores of 6 randomly selected students and the number of hours they studied for the test. Hours 5 10 4 6 10 9 Score 64 86 69 86 59 87 D) 0.224 C) 0.678 B) -0.678 A) -0.224 Explain how you found the linear correlation coefficient.
17. Explain how you found the linear correlation
coefficient.
Find the value of the linear correlation coefficient r. Points: 5 17) The paired data below consist of the test scores of 6 randomly selected students and the number of hours they studied for the test. Hours 5 10 4 6 10 9 Score 64 86 69 86 59 87 D) 0.224 C) 0.678 B) -0.678 A) -0.224 Explain how you found the linear correlation coefficient.
Most questions answered within 3 hours.
-
calculate change in entropy and change in enthalpy for freezing
1 mol of water at -10C...
asked 5 minutes ago -
In your opinion, did anyone "win" the Cold War? If no, why? If
yes, who won...
asked 9 minutes ago -
a) Determine the saturation dissolved oxygen concentration at
sea-level at 1 atm and 20° C in...
asked 7 minutes ago -
Please complete the implementation of the four functions IN
C.
//************************************************************************************/
//
// countNumberofOnes
//
//...
asked 9 minutes ago -
Shown below are the budgeted sales for ABC Company for
the next six months:
Sales...
asked 14 minutes ago -
A balance sheet shows exactly where a business stands at any
given point in time. It...
asked 15 minutes ago -
For the reaction between ethylene and chlorine, the equilibrium
constant is 2.00x10^6. If the initial concentrations...
asked 22 minutes ago -
What is the energy released in this β+ nuclear reaction
23/12Mg→23/11Na+0/1e (The atomic mass of 23Mg...
asked 37 minutes ago -
Choose one:
Periodic Inventory Accounting is less expensive to maintain
than Perpetual Inventory Accounting
Periodic Inventory...
asked 34 minutes ago -
4. Describe the role played by glutamine in the transport of
nitrogen.
asked 33 minutes ago -
1. In IntelliJ create a new project called F1_2
2. In the Project window create a...
asked 38 minutes ago -
30 mL of 1 M HCl were added to 200 mL of 0.1 M lysine solution...
asked 46 minutes ago