
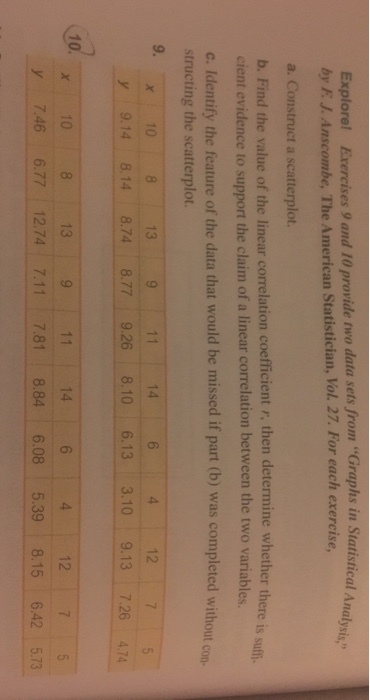
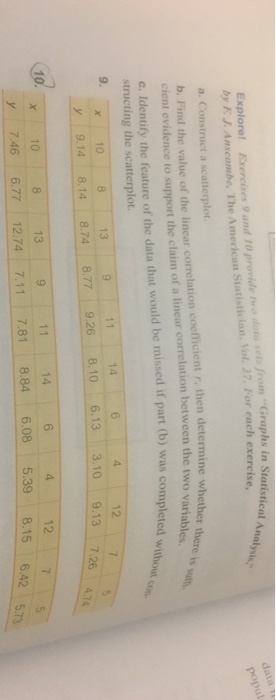
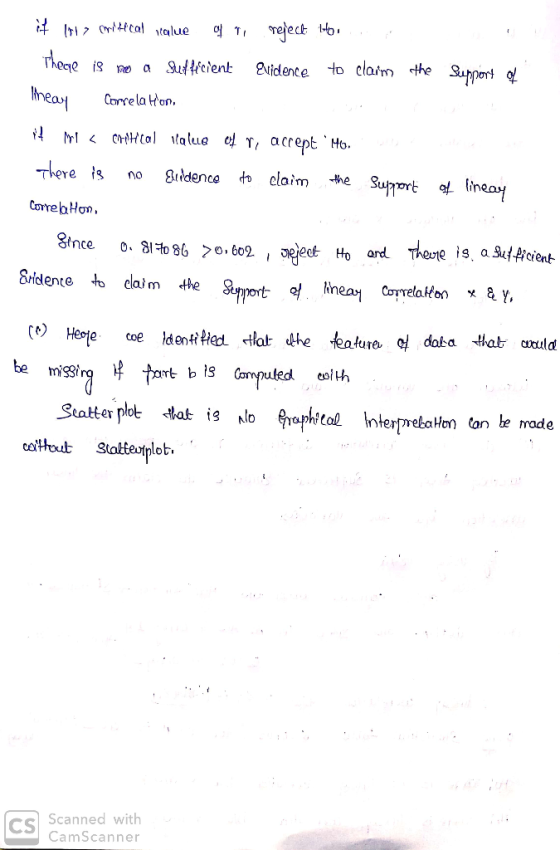
Graphs in Statistical A plore! Exercises 9 and 10 provide two data sets from " by E J. Anscombe, The American Statistician, Vol. 27. For each exercise a. Construct a scatterplot b. Find the value of the linear correlation coefficient r, then determine whether there is suft stical Analvi Ex cient evidence to support the claim of a linear correlation between the two variables. c. Identify the feature of the data that would be missed if part (b) was completed without con. structing the scatterplot. 9. 14 6 4 12 75 y 9.14 8.14 8.74 8.77 9.26 8.10 6.13 3.10 9.13 7.26 4.74 10. 10 813 9 11 14 6 4 1275 y 7.46 6.77 12.74 7.11 7.81 8.84 6.08 5.39 8.15 6.42 5.73
Exploret Exercises 9 and 10 provide two dota sets from "Graphs in Sta a. Construct a scatterplot b. Find the value of the linear correlation coeficient r, then determine w For each exercise cient evidence to support the claim of a linear correlation between the t e. Identify the feature of the data that would be missed if part (b) was completed w structing the scatterplot. 1464 12 9 9 13 x10 3.10ーー9.13.7.26 9.26一8.10一一6.13 877 8.74 9.14 8.14 У 8 13911 14 6 10. x 10 12 У 7.46 6.77 12.74| 7.11 7.81_-8.84-6.08-5.398.1 5 6.42 5.73
Homework Answers

 10(A) SCATTER PLOT
Add Answer to:
4 Scatterplots Match these values of r with the five scatterplots shown here and the next page: 0...
Find the correlation for the following dataset: x 10 8 13 9 11 14 6 4...
Find the correlation for the following dataset: x 10 8 13 9 11 14 6 4 12 7 5 y 7.46 6.77 12.74 7.11 7.81 8.84 6.08 5.39 8.15 6.42 5.73 I. 0.856 II. 0.502 III. 0.816 IV. 0.742
Use the given data to find the equation of the regression line. Examine the scatterplot and...
 Use the given data to find the equation of the regression line. Examine the scatterplot and identify a characteristic of the data that is ignored by the regression line 4 7 5 х 6 6.08 12 8.15 10 8 13 9 11 14 7.46 6.77 7.11 7.81 8.84 y = -2.72 +4.10x, the data have a pattern that is not a straight line 12.74 5.39 6.42 у 5.73 D = -2.72 +4.10x, the regression line fits the points well D...
show work Show Work Question Help Use the given data set to complete parts (a) through...
 show work
Show Work Question Help Use the given data set to complete parts (a) through (c) below. (Use a = 0.05.) x 10 8 13 19 T 11 T 14 16 14 | y 7.46 6.77 12.74 7.12 7.81 8 .84 6.09 5.39 12 8.15 7 6.42 5 5.73 = Click here to view a table of critical values for the correlation coefficient a. Construct a scatterplot. Choose the correct graph below. OA OB. 638 12 16 06 12...
show work
Show Work Question Help Use the given data set to complete parts (a) through (c) below. (Use a = 0.05.) x 10 8 13 19 T 11 T 14 16 14 | y 7.46 6.77 12.74 7.12 7.81 8 .84 6.09 5.39 12 8.15 7 6.42 5 5.73 = Click here to view a table of critical values for the correlation coefficient a. Construct a scatterplot. Choose the correct graph below. OA OB. 638 12 16 06 12...
Use the given data set to complete parts (a) through (c) below. (Use alphaαequals=0.05.) x 10...
Use the given data set to complete parts (a) through (c) below. (Use alphaαequals=0.05.) x 10 8 13 9 11 14 6 4 12 7 5 y 7.46 6.77 12.75 7.12 7.81 8.83 6.08 5.38 8.15 6.42 5.73 b. Find the linear correlation coefficient, r, then determine whether there is sufficient evidence to support the claim of a linear correlation between the two variables. The linear correlation coefficient is r=? (Round to three decimal places as needed.)
Use the given data set to complete parts (a) through (c) below. (Use a=0.05.) X: 10...
Use the given data set to complete parts (a) through (c) below. (Use a=0.05.) X: 10 8 13 9 11 14 6 4 12 7 5 Y: 9.14 8.15 8.74 8.78 9.26 8.11 6.13 3.11 9.13 7.26 4.74 The linear correlation coefficient is r= Determine whether there is sufficient evidence to support the claim of a linear correlation between two variables. Identify the feature of the data that would be missed if part b was completed with out the construction...
Use the given data set to complete parts (a) through (c) below. (Use a = 0.05.)...
 Use the given data set to complete parts (a) through (c) below. (Use a = 0.05.) 5 х у 10 9.14 8 8.14 13 8.73 9 8.76 11 9.26 14 8.09 6 6.13 4 3.09 12 9.13 7 7.25 4.73 Click here to view a table of critical values for the correlation coefficient. a. Construct a scatterplot. Choose the correct graph below. OA. OB. O c. OD y AY 10- 8- Ay 10-1 a 10- 10- 8- 6- 8-1 8-...
Use the given data set to complete parts (a) through (c) below. (Use a=0.05.) n х...
 Use the given data set to complete parts (a) through (c) below. (Use a=0.05.) n х 10 9.14 8 8.14 13 8.74 11 9.26 14 8.11 6 6.13 4 3.11 12 9.12 7 7.26 5 4.75 y 8.77 Click here to view a table of critical values for the correlation coefficient. a. Construct a scatterplot. Choose the correct graph below. O A. B. D Ay 10- AY 10- 8 лу 10- AY 10- 8- 8- 8- 6- 6- 6- 6-...
... Use the given data set to complete parts (a) through (C) below. (Use a =...
 ... Use the given data set to complete parts (a) through (C) below. (Use a = 0.05.) X 6 7 10 7.45 8 6.76 13 12.74 9 7.11 11 7.81 14 8.84 4 5.39 12 8.14 5 5.72 y 6.08 6.41 Click here to view a table of critical values for the correlation coefficient. a. Construct a scatterplot. Choose the correct graph below. OA. OB. OC. OD 16- AY 16- AY 167 AY 16 12- 12 12 a 12- 8-...
The best predicted number of Nobel Laureates when the number of internet users per 100 is...
 The best predicted number of Nobel
Laureates when the number of internet users per 100 is 79.9
is...........(Round to one decimal place as needed.)
Use the given data set to complete parts (a) through (c) below. (Use a = 0.05.) X у 10 7.46 8 6.78 13 12.73 9 7.11 11 7.82 14 8.85 6 6.08 4 5.39 12 8.15 7 6.43 5 5.73 Click here to view a table of critical values for the correlation coefficient. a. Construct a...
The best predicted number of Nobel
Laureates when the number of internet users per 100 is 79.9
is...........(Round to one decimal place as needed.)
Use the given data set to complete parts (a) through (c) below. (Use a = 0.05.) X у 10 7.46 8 6.78 13 12.73 9 7.11 11 7.82 14 8.85 6 6.08 4 5.39 12 8.15 7 6.43 5 5.73 Click here to view a table of critical values for the correlation coefficient. a. Construct a...
Use the given data set to complete parts (a) through (C) below. (Use a = 0.05.)...
 Use the given data set to complete parts (a) through (C) below. (Use a = 0.05.) 10 9.14 8 8.15 13 8.74 9 8.77 11 9.27 14 8.09 6 6.13 4 3.09 12 9.13 5 4.75 7.26 Click here to view a table of critical values for the correlation coefficient. a. Construct a scatterplot. Choose the correct graph below. OA OB. OC. OD. AY 10- 8 10- 10 8 10- 8- 6 6- 6- . 6- 4 4 4- 4...
 Use the given data to find the equation of the regression line. Examine the scatterplot and identify a characteristic of the data that is ignored by the regression line 4 7 5 х 6 6.08 12 8.15 10 8 13 9 11 14 7.46 6.77 7.11 7.81 8.84 y = -2.72 +4.10x, the data have a pattern that is not a straight line 12.74 5.39 6.42 у 5.73 D = -2.72 +4.10x, the regression line fits the points well D...
 show work
Show Work Question Help Use the given data set to complete parts (a) through (c) below. (Use a = 0.05.) x 10 8 13 19 T 11 T 14 16 14 | y 7.46 6.77 12.74 7.12 7.81 8 .84 6.09 5.39 12 8.15 7 6.42 5 5.73 = Click here to view a table of critical values for the correlation coefficient a. Construct a scatterplot. Choose the correct graph below. OA OB. 638 12 16 06 12...
show work
Show Work Question Help Use the given data set to complete parts (a) through (c) below. (Use a = 0.05.) x 10 8 13 19 T 11 T 14 16 14 | y 7.46 6.77 12.74 7.12 7.81 8 .84 6.09 5.39 12 8.15 7 6.42 5 5.73 = Click here to view a table of critical values for the correlation coefficient a. Construct a scatterplot. Choose the correct graph below. OA OB. 638 12 16 06 12...
 Use the given data set to complete parts (a) through (c) below. (Use a = 0.05.) 5 х у 10 9.14 8 8.14 13 8.73 9 8.76 11 9.26 14 8.09 6 6.13 4 3.09 12 9.13 7 7.25 4.73 Click here to view a table of critical values for the correlation coefficient. a. Construct a scatterplot. Choose the correct graph below. OA. OB. O c. OD y AY 10- 8- Ay 10-1 a 10- 10- 8- 6- 8-1 8-...
 Use the given data set to complete parts (a) through (c) below. (Use a=0.05.) n х 10 9.14 8 8.14 13 8.74 11 9.26 14 8.11 6 6.13 4 3.11 12 9.12 7 7.26 5 4.75 y 8.77 Click here to view a table of critical values for the correlation coefficient. a. Construct a scatterplot. Choose the correct graph below. O A. B. D Ay 10- AY 10- 8 лу 10- AY 10- 8- 8- 8- 6- 6- 6- 6-...
 ... Use the given data set to complete parts (a) through (C) below. (Use a = 0.05.) X 6 7 10 7.45 8 6.76 13 12.74 9 7.11 11 7.81 14 8.84 4 5.39 12 8.14 5 5.72 y 6.08 6.41 Click here to view a table of critical values for the correlation coefficient. a. Construct a scatterplot. Choose the correct graph below. OA. OB. OC. OD 16- AY 16- AY 167 AY 16 12- 12 12 a 12- 8-...
 The best predicted number of Nobel
Laureates when the number of internet users per 100 is 79.9
is...........(Round to one decimal place as needed.)
Use the given data set to complete parts (a) through (c) below. (Use a = 0.05.) X у 10 7.46 8 6.78 13 12.73 9 7.11 11 7.82 14 8.85 6 6.08 4 5.39 12 8.15 7 6.43 5 5.73 Click here to view a table of critical values for the correlation coefficient. a. Construct a...
The best predicted number of Nobel
Laureates when the number of internet users per 100 is 79.9
is...........(Round to one decimal place as needed.)
Use the given data set to complete parts (a) through (c) below. (Use a = 0.05.) X у 10 7.46 8 6.78 13 12.73 9 7.11 11 7.82 14 8.85 6 6.08 4 5.39 12 8.15 7 6.43 5 5.73 Click here to view a table of critical values for the correlation coefficient. a. Construct a...
 Use the given data set to complete parts (a) through (C) below. (Use a = 0.05.) 10 9.14 8 8.15 13 8.74 9 8.77 11 9.27 14 8.09 6 6.13 4 3.09 12 9.13 5 4.75 7.26 Click here to view a table of critical values for the correlation coefficient. a. Construct a scatterplot. Choose the correct graph below. OA OB. OC. OD. AY 10- 8 10- 10 8 10- 8- 6 6- 6- . 6- 4 4 4- 4...
Most questions answered within 3 hours.
-
Why are polymers not typically casted into products?
asked 2 minutes ago -
When rolling a die 129 times, what is the probability of rolling
a 6 no more...
asked 19 minutes ago -
4. A call option currently sells for $7.75. It has a strike
price of $85 and...
asked 8 minutes ago -
1.
You need to prepare 10.0 liters of an acid aqueous solution with a
pH of...
asked 11 minutes ago -
Along an aggregate supply curve, if the level of output is less
than the natural level...
asked 11 minutes ago -
By 2025, annual consumption in emerging markets will total $30
trillion and contribute more than ________...
asked 16 minutes ago -
At what point does reformation cease to be a viable option for
those who are oppressed...
asked 20 minutes ago -
Place letters corresponding to amounts in the proper order for
lightest to heaviest samples:
a) 2100...
asked 25 minutes ago -
Consider the multicore processor with 6 heterogeneous cores
labelled C1, C2, C3, C4, C5, and C6....
asked 27 minutes ago -
Document system components according to standards and procedures
(Implement and hand over system components) IT administrative
asked 28 minutes ago -
The college asked 700 students if they wanted a longer spring
break and 600 students said...
asked 27 minutes ago -
Determine the temperature (in Celsius) at which 1.00 mole of an
ideal gas will have a...
asked 52 minutes ago