

Homework Answers


Add Answer to:
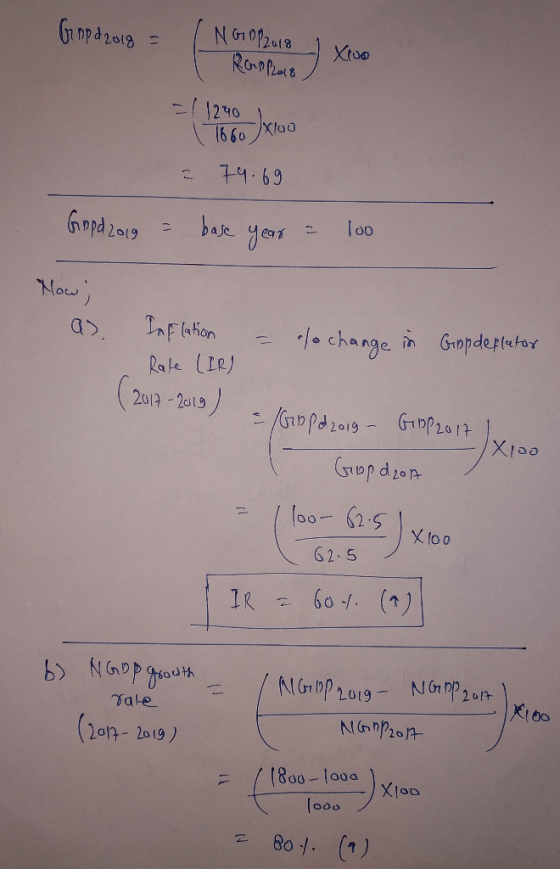
only answer for question 5
4. Calculate the Nominal GDP, Real GDP using 2019 as the...
4. Calculate the Nominal GDP, Real GDP using 2019 as the base year, and the GDP...
 4. Calculate the Nominal GDP, Real GDP using 2019 as the base year, and the GDP Deflator. Year Price of Milk Quantity of Milk Price of Honey Quantity of Honey 2017 $2 100 $4 200 2018 $4 100 $4 210 2019 $4 120 $6 220
Below are some data from the land of milk and honey. Compute nominal GDP, real GDP,...
Below are some data from the land of milk and honey. Compute nominal GDP, real GDP, and the GDP deflator for each year, using 2008 as the base year. Compute the percentage change in nominal GDP, real GDP, and the GDP deflator in 2009 and 2010 from the preceding year. For each year, identify the variable that does not change. Explain in words why your answers make sense. Did economic well-being rise more in 2009 or 2010? Explain Year Price...
4- Attached are some data from the land of milk and honey, a. Compute nominal GDP,...
 4- Attached are some data from the land of milk and honey, a. Compute nominal GDP, real GDP for years 2014 and 2015, using 2013 as the base yoar. b. Compute the percentage change in real GDP, and compute the GDP deflator in 2014 and 2015. Year 2013 2014 2015 Price of Milk $1 1 2. Quantity of Milk (litres) 100 200 200 Price of Honey $2 2 Quantity of Honey (litres) 50 100 100 4.
4. Real Versus Nominal GDP Aa Aa Consider a simple economy that produces two goods: cupcakes...
 4. Real Versus Nominal GDP Aa Aa Consider a simple economy that produces two goods: cupcakes and muffins. The following table shows the prices and quantities for the goods over a three-year period. Prices and Quantities Price of Quantity of Price of cupcakes (6) cupcakes muffins (C) 150 2 2003 200 Quantity of muffins Year 2016 2017 2018 100 150 100 Use the information from the previous table to fill in the following table. Real GDP (Base year 2016) (C)...
5. Real versus nominal GDP Consider a simple economy that produces two goods: pencils and erasers....
 5. Real versus nominal GDP Consider a simple economy that produces two goods: pencils and erasers. The following table shows the prices and quantities of the goods over a three-year period. Pencils Price Quantity (Dollars per pencil (Number of pencils) 1 125 Erasers Price Quantity (Dollars per eraser (Number of erasers) 1 200 Year 2018 2019 170 4 230 2020 4 150 4 170 Use the information from the preceding table to fill in the following table. Nominal GDP (Dollars)...
Based on the table below, calculate nominal GDP, real GDP, the GDP deflator, and the inflation...
 Based on the table below, calculate nominal GDP, real GDP, the GDP deflator, and the inflation rate in each year and fill in the missing parts of the table. Use 2014 as the base year. Instructions: Round nominal and real GDP values to two decimal places. Round GDP deflator and inflation rate values to the nearest whole number. Price of Quantity of Price of orange ($) Quantity of oranges 700 beach balls beach ball Nominal GDP ($) Real GDP ($)...
5. Real versus nominal GDP Consider a simple economy that produces two goods: pencils and envelopes....
 5. Real versus nominal GDP Consider a simple economy that produces two goods: pencils and envelopes. The following table shows the prices and quantities of the goods over a three-year period. Year 2016 2017 2018 Pencils Price Quantity (Dollars per (Number of pencil) pencils) 125 170 150 Envelopes Price Quantity (Dollars per (Number of envelope) envelopes) 200 230 170 HN Use the information from the preceding table to fill in the following table. Nominal GDP (Dollars Real GDP (Base year...
5. Real versus nominal GDP Consider a simple economy that produces two goods: pencils and oranges. The following table s...
5. Real versus nominal GDP Consider a simple economy that produces two goods: pencils and oranges. The following table shows the prices and quantities of the goods over a three-year period. Year Pencils Oranges Price Quantity Price Quantity (Dollars per pencil) (Number of pencils) (Dollars per orange) (Number of oranges) Year Pencils Oranges Price Quantity Price Quantity (Dollars per pencil) (Number of pencils) (Dollars per orange) (Number of oranges) 2016 2 125 3 155 2017 4 135 3 210 2018...
5. Real versus nominal GDP Consider a simple economy that produces two goods: pens and erasers....
5. Real versus nominal GDP Consider a simple economy that produces two goods: pens and erasers. The following table shows the prices and quantities of the goods over a three-year period. Year Pens Erasers Price Quantity Price Quantity (Dollars per pen) (Number of pens) (Dollars per eraser) (Number of erasers) 2018 2 115 5 175 2019 4 150 2 180 2020 1 100 2 160 Use the information from the preceding table to fill in the following table. Year Nominal...
From 2014 to 2015, nominal GDP ______ (DECREASED OR INCREASED) , and real GDP _____ (Decreased...
 From 2014 to 2015, nominal GDP ______ (DECREASED OR INCREASED) ,
and real GDP _____ (Decreased or increased)
The inflation rate in 2015 was __ (-30%, 0.3%, 76.9%, or
130%)
Consider a simple economy that produces two goods: cupcakes and erasers. The following table shows the prices and quantities of the goods over three-year period Cupcakes Erasers Price Quantity (Number of cupcakes) 125 135 100 Price Quantity (Number of erasers) 155 210 200 (Dollars per cupcake) (Dollars per eraser) Year...
From 2014 to 2015, nominal GDP ______ (DECREASED OR INCREASED) ,
and real GDP _____ (Decreased or increased)
The inflation rate in 2015 was __ (-30%, 0.3%, 76.9%, or
130%)
Consider a simple economy that produces two goods: cupcakes and erasers. The following table shows the prices and quantities of the goods over three-year period Cupcakes Erasers Price Quantity (Number of cupcakes) 125 135 100 Price Quantity (Number of erasers) 155 210 200 (Dollars per cupcake) (Dollars per eraser) Year...
 4. Calculate the Nominal GDP, Real GDP using 2019 as the base year, and the GDP Deflator. Year Price of Milk Quantity of Milk Price of Honey Quantity of Honey 2017 $2 100 $4 200 2018 $4 100 $4 210 2019 $4 120 $6 220
 4- Attached are some data from the land of milk and honey, a. Compute nominal GDP, real GDP for years 2014 and 2015, using 2013 as the base yoar. b. Compute the percentage change in real GDP, and compute the GDP deflator in 2014 and 2015. Year 2013 2014 2015 Price of Milk $1 1 2. Quantity of Milk (litres) 100 200 200 Price of Honey $2 2 Quantity of Honey (litres) 50 100 100 4.
 4. Real Versus Nominal GDP Aa Aa Consider a simple economy that produces two goods: cupcakes and muffins. The following table shows the prices and quantities for the goods over a three-year period. Prices and Quantities Price of Quantity of Price of cupcakes (6) cupcakes muffins (C) 150 2 2003 200 Quantity of muffins Year 2016 2017 2018 100 150 100 Use the information from the previous table to fill in the following table. Real GDP (Base year 2016) (C)...
 5. Real versus nominal GDP Consider a simple economy that produces two goods: pencils and erasers. The following table shows the prices and quantities of the goods over a three-year period. Pencils Price Quantity (Dollars per pencil (Number of pencils) 1 125 Erasers Price Quantity (Dollars per eraser (Number of erasers) 1 200 Year 2018 2019 170 4 230 2020 4 150 4 170 Use the information from the preceding table to fill in the following table. Nominal GDP (Dollars)...
 Based on the table below, calculate nominal GDP, real GDP, the GDP deflator, and the inflation rate in each year and fill in the missing parts of the table. Use 2014 as the base year. Instructions: Round nominal and real GDP values to two decimal places. Round GDP deflator and inflation rate values to the nearest whole number. Price of Quantity of Price of orange ($) Quantity of oranges 700 beach balls beach ball Nominal GDP ($) Real GDP ($)...
 5. Real versus nominal GDP Consider a simple economy that produces two goods: pencils and envelopes. The following table shows the prices and quantities of the goods over a three-year period. Year 2016 2017 2018 Pencils Price Quantity (Dollars per (Number of pencil) pencils) 125 170 150 Envelopes Price Quantity (Dollars per (Number of envelope) envelopes) 200 230 170 HN Use the information from the preceding table to fill in the following table. Nominal GDP (Dollars Real GDP (Base year...
 From 2014 to 2015, nominal GDP ______ (DECREASED OR INCREASED) ,
and real GDP _____ (Decreased or increased)
The inflation rate in 2015 was __ (-30%, 0.3%, 76.9%, or
130%)
Consider a simple economy that produces two goods: cupcakes and erasers. The following table shows the prices and quantities of the goods over three-year period Cupcakes Erasers Price Quantity (Number of cupcakes) 125 135 100 Price Quantity (Number of erasers) 155 210 200 (Dollars per cupcake) (Dollars per eraser) Year...
From 2014 to 2015, nominal GDP ______ (DECREASED OR INCREASED) ,
and real GDP _____ (Decreased or increased)
The inflation rate in 2015 was __ (-30%, 0.3%, 76.9%, or
130%)
Consider a simple economy that produces two goods: cupcakes and erasers. The following table shows the prices and quantities of the goods over three-year period Cupcakes Erasers Price Quantity (Number of cupcakes) 125 135 100 Price Quantity (Number of erasers) 155 210 200 (Dollars per cupcake) (Dollars per eraser) Year...
Most questions answered within 3 hours.
-
An electric field at a spatial point does NOT depend on: (Choose
all the answers)
a....
asked 1 minute ago -
As you being to perform the network-mapping phase of the
scenario, you have been asked what...
asked 4 minutes ago -
Find the sample size, n, needed to estimate the percentage of
adults who have consulted fortune...
asked 22 minutes ago -
When the relationship is perfect, the regression of Y on X is a
perfect straight line....
asked 38 minutes ago -
What would be the balanced equation for the addition of
concentrated hydrochloric acid to cobalt chloride?...
asked 43 minutes ago -
Regarding a constructive discharge claim, whether an employee's
working conditions were so intolerable that he/she had...
asked 43 minutes ago -
Use a z -Table to find the specified area.
Between the mean and 3.01 deviations from...
asked 45 minutes ago -
If the rate constant for a particular reaction
triples between 35 °C and
70 °C, calculate...
asked 50 minutes ago -
if a magnetic field of 0.634 T is measured a distance of 0.009 m
away from...
asked 54 minutes ago -
In
the past, Ben has been able to hit a baseball at the batting cage
20%...
asked 57 minutes ago -
"Function does not take 0 arguments". I keep getting this error
for my last line of...
asked 58 minutes ago -
C++
What are the advantages of having a full copy of an object over
just having...
asked 58 minutes ago