The following data (excluded outlier) is collected from English Fall session homework #4. Assume that distribution...
The following data (excluded outlier) is collected from English Fall session homework #4. Assume that distribution is normally distributed.
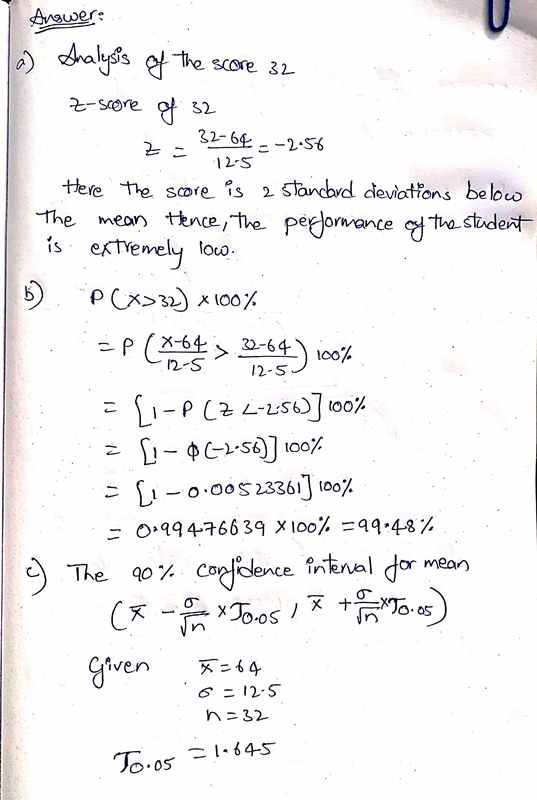
sample size 32 ,mean 64 ,Sample standard deviation 15.82 ,population standard deviation 12.5 ,max 90 ,Q1 60 ,Median 69.5, Q3 75
Your homework #4 Score is 32
1. Analyze your score based on the date above.
2. Assume that distribution is bell-shaped, find the percentage who scored greater than your homework score. Analyze your homework score based on the percentage you found.
3. Find 90% confidence interval for the population mean. (a) Interpret the result. (b) How do you analyze your homework score from (a)?
4. For English , the passing rate is 53%. Find the probability that at least 23 students pass your course.
5. If a English department chair says that the average homework 4 score ( entire students) for English is 60/100 pts. Do you believe it? Show your work.
Show which function if you use for TI84 please.
Homework Answers

Add Answer to:
The following data (excluded outlier) is collected from English
Fall session homework #4. Assume that distribution...
For math class, the passing rate is 53%. Find the probability that at least 23 students...
 For math class, the passing rate is 53%. Find the probability
that at least 23 students pass your course.
sample size 32 mean 64 15.82 Sample standard deviation population standard deviation 12.5 max 90 Q1 60 Median 69.5 Q3 75
For math class, the passing rate is 53%. Find the probability
that at least 23 students pass your course.
sample size 32 mean 64 15.82 Sample standard deviation population standard deviation 12.5 max 90 Q1 60 Median 69.5 Q3 75
If a math department chair says that the average score for math is 60 out of...
 If a math department chair says that the average score for math
is 60 out of 100 pts. Do you believe it? Show your work.
sample size 32 mean 64 15.82 Sample standard deviation population standard deviation 12.5 max 90 Q1 60 Median 69.5 Q3 75
If a math department chair says that the average score for math
is 60 out of 100 pts. Do you believe it? Show your work.
sample size 32 mean 64 15.82 Sample standard deviation population standard deviation 12.5 max 90 Q1 60 Median 69.5 Q3 75
For math class, the passing rate is 53%. Find the probability that at least 23 students...
 For math class, the passing rate is 53%. Find the probability
that at least 23 students pass your course.
Please write notes readable.
sample size 32 mean 64 15.82 Sample standard deviation population standard deviation 12.5 max 90 Q1 60 Median 69.5 Q3 75
For math class, the passing rate is 53%. Find the probability
that at least 23 students pass your course.
Please write notes readable.
sample size 32 mean 64 15.82 Sample standard deviation population standard deviation 12.5 max 90 Q1 60 Median 69.5 Q3 75
The graph illustrates the distribution of test scores taken by College Algebra students. The maximum possible...
 The graph illustrates the distribution of test scores taken by College Algebra students. The maximum possible score on the test was 140, while the mean score was 75 and the standard deviation was 15. 30 45 105 120 60 75 90 Distribution of Test Scores Using the Empirical Rule, What is the approximate percentage of students who scored between 45 and 105 on the test? % What is the approximate percentage of students who scored higher than 105 on the...
Assume the grades has Normal distribution with the mean of 70, and the standard deviation of 15. Answer the following questions 1. Calculate 10t 25t* 50 75t and 90* percentiles once by converting to...
 Assume the grades has Normal distribution with the mean of 70, and the standard deviation of 15. Answer the following questions 1. Calculate 10t 25t* 50 75t and 90* percentiles once by converting to the standard Normal distribution, and again directly (using the non-standard Normal distribution) 2. What percentage of students score between 80 and 90 in the exam? 3. What percentage of students fail? 4. What percentage of students pass with A? 5. Generate a sample of size 16...
Scores on the SAT mathematics section have a normal distribution with mean 4-500 and standard deviation...
 Scores on the SAT mathematics section have a normal distribution with mean 4-500 and standard deviation o=100. a. What proportion of students score above a 550 on the SAT mathematics section? Round your answer to 4 decimal places. b. Suppose that you choose a simple random sample of 16 students who took the SAT mathematics section and find the sample mean x of their scores. Which of the following best describes what you would expect? The sample mean will be...
You will be given a series of questions regarding a normal distribution, you will be asked...
 You will be given a series of questions regarding a normal
distribution, you will be asked to either determine the percentage
above or below particular raw scores; or to calculate the raw score
that will correspond to a particular percentage.
You will be asked to calculate either raw scores or
percentages. For each question write out your calculation, the
appropriate Z score, what on the curve you should be shading, the
exact percentage from the normal curve table and the...
You will be given a series of questions regarding a normal
distribution, you will be asked to either determine the percentage
above or below particular raw scores; or to calculate the raw score
that will correspond to a particular percentage.
You will be asked to calculate either raw scores or
percentages. For each question write out your calculation, the
appropriate Z score, what on the curve you should be shading, the
exact percentage from the normal curve table and the...
1) A sample of size 25 is chosen from a population. Assume the probability distribution is...
1) A sample of size 25 is chosen from a population. Assume the probability distribution is normal. If the mean of the sample is 80 and the standard deviation is 6, find the lower bound of the 99% confidence interval. Round off to three decimal places. 2) A sample of size 36 is chosen from a population. The sample mean is 50 and the standard deviation is 5. Find the upper limit of the 95% confidence interval for the population...
Calculating percentages You will be glven a series of questions regarding a normal distribution, you will...
 Calculating percentages
You will be glven a series of questions regarding a normal distribution, you will be asked to elther determine the percentage above or below particular raw scores; or to calculate the raw score that will correspond to a particular percentage. You will be asked to calculate either raw scores or percentages. For each questign write out your calculation, the appropriate Z score, what on the curve you should be shading, the exact percentage from the normal curve table...
Calculating percentages
You will be glven a series of questions regarding a normal distribution, you will be asked to elther determine the percentage above or below particular raw scores; or to calculate the raw score that will correspond to a particular percentage. You will be asked to calculate either raw scores or percentages. For each questign write out your calculation, the appropriate Z score, what on the curve you should be shading, the exact percentage from the normal curve table...
4 Comparing Classrooms In Fall 2013, I taught ECON102 in Sparks (346 students enrolled) and Forum...
 4 Comparing Classrooms In Fall 2013, I taught ECON102 in Sparks (346 students enrolled) and Forum (360 students enrolled) I would like to compare the second test results for the two classes. The numbers in this problem are reported as a percentage score. Use the data for the following questions. Assume that the difference in test score is Forum minus Sparks You have impressively managed to track down some of my students from those classes and asked them to show...
 For math class, the passing rate is 53%. Find the probability
that at least 23 students pass your course.
sample size 32 mean 64 15.82 Sample standard deviation population standard deviation 12.5 max 90 Q1 60 Median 69.5 Q3 75
For math class, the passing rate is 53%. Find the probability
that at least 23 students pass your course.
sample size 32 mean 64 15.82 Sample standard deviation population standard deviation 12.5 max 90 Q1 60 Median 69.5 Q3 75
 If a math department chair says that the average score for math
is 60 out of 100 pts. Do you believe it? Show your work.
sample size 32 mean 64 15.82 Sample standard deviation population standard deviation 12.5 max 90 Q1 60 Median 69.5 Q3 75
If a math department chair says that the average score for math
is 60 out of 100 pts. Do you believe it? Show your work.
sample size 32 mean 64 15.82 Sample standard deviation population standard deviation 12.5 max 90 Q1 60 Median 69.5 Q3 75
 For math class, the passing rate is 53%. Find the probability
that at least 23 students pass your course.
Please write notes readable.
sample size 32 mean 64 15.82 Sample standard deviation population standard deviation 12.5 max 90 Q1 60 Median 69.5 Q3 75
For math class, the passing rate is 53%. Find the probability
that at least 23 students pass your course.
Please write notes readable.
sample size 32 mean 64 15.82 Sample standard deviation population standard deviation 12.5 max 90 Q1 60 Median 69.5 Q3 75
 The graph illustrates the distribution of test scores taken by College Algebra students. The maximum possible score on the test was 140, while the mean score was 75 and the standard deviation was 15. 30 45 105 120 60 75 90 Distribution of Test Scores Using the Empirical Rule, What is the approximate percentage of students who scored between 45 and 105 on the test? % What is the approximate percentage of students who scored higher than 105 on the...
 Assume the grades has Normal distribution with the mean of 70, and the standard deviation of 15. Answer the following questions 1. Calculate 10t 25t* 50 75t and 90* percentiles once by converting to the standard Normal distribution, and again directly (using the non-standard Normal distribution) 2. What percentage of students score between 80 and 90 in the exam? 3. What percentage of students fail? 4. What percentage of students pass with A? 5. Generate a sample of size 16...
 Scores on the SAT mathematics section have a normal distribution with mean 4-500 and standard deviation o=100. a. What proportion of students score above a 550 on the SAT mathematics section? Round your answer to 4 decimal places. b. Suppose that you choose a simple random sample of 16 students who took the SAT mathematics section and find the sample mean x of their scores. Which of the following best describes what you would expect? The sample mean will be...
 You will be given a series of questions regarding a normal
distribution, you will be asked to either determine the percentage
above or below particular raw scores; or to calculate the raw score
that will correspond to a particular percentage.
You will be asked to calculate either raw scores or
percentages. For each question write out your calculation, the
appropriate Z score, what on the curve you should be shading, the
exact percentage from the normal curve table and the...
You will be given a series of questions regarding a normal
distribution, you will be asked to either determine the percentage
above or below particular raw scores; or to calculate the raw score
that will correspond to a particular percentage.
You will be asked to calculate either raw scores or
percentages. For each question write out your calculation, the
appropriate Z score, what on the curve you should be shading, the
exact percentage from the normal curve table and the...
 Calculating percentages
You will be glven a series of questions regarding a normal distribution, you will be asked to elther determine the percentage above or below particular raw scores; or to calculate the raw score that will correspond to a particular percentage. You will be asked to calculate either raw scores or percentages. For each questign write out your calculation, the appropriate Z score, what on the curve you should be shading, the exact percentage from the normal curve table...
Calculating percentages
You will be glven a series of questions regarding a normal distribution, you will be asked to elther determine the percentage above or below particular raw scores; or to calculate the raw score that will correspond to a particular percentage. You will be asked to calculate either raw scores or percentages. For each questign write out your calculation, the appropriate Z score, what on the curve you should be shading, the exact percentage from the normal curve table...
 4 Comparing Classrooms In Fall 2013, I taught ECON102 in Sparks (346 students enrolled) and Forum (360 students enrolled) I would like to compare the second test results for the two classes. The numbers in this problem are reported as a percentage score. Use the data for the following questions. Assume that the difference in test score is Forum minus Sparks You have impressively managed to track down some of my students from those classes and asked them to show...
Most questions answered within 3 hours.
-
An object in front of a concave mirror has a real image that is
11.5 cm...
asked 7 minutes ago -
Consider the reaction, C3 H8 + O2 --> CO2 + H2O. How many
moles of O2...
asked 1 hour ago -
You and your opponent both roll a fair die. If you both roll the
same number,...
asked 2 hours ago -
In a study of the accuracy of fast food drive-through orders,
Restaurant A had 257 accurate...
asked 2 hours ago -
Identify and describe in detail the four categories of
institutions that could be included in a...
asked 2 hours ago -
In python
class Customer:
def __init__(self, customer_id, last_name, first_name, phone_number, address):
self._customer_id = int(customer_id)
self._last_name =...
asked 2 hours ago -
What is an example of a limitation in implementing a new
ERP system and how it...
asked 2 hours ago -
In a section of 9.7cm of an artery with a radius of 2.6mm there
is a...
asked 2 hours ago -
the two carboxylic acid groups of aspartic acid have different
acidities with pKa values of 2.1...
asked 2 hours ago -
Would CuCO3 aqueous salt combined with calcium chloride
form a solid precipitate? If so, what would...
asked 2 hours ago -
How do ECM Solutions assist in embedding a culture of continuous
improvement in an organization? (Project...
asked 2 hours ago -
Directions
These directions introduce the idea of Essential Questions.
Since this may be a new concept...
asked 2 hours ago