


Homework Answers
The statistical software output for this problem is:
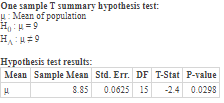
From above output:
H0 : μ = 9
H1 : μ ≠ 9
Type: t; Degrees of freedom = 15
Test statistic = -2.4
Critical values = -1.753 and 1.753
Conclusion: Yes
Add Answer to:
A coin-operated drink machine was designed to discharge a mean of 9 ounces of coffee per...
A coin-operated drink machine was designed to discharge a mean of 6 ounces of coffee per...
 A coin-operated drink machine was designed to discharge a mean of 6 ounces of coffee per cup. In a test of the machine, the discharge amounts in 12 randomly chosen cups of coffee from the machine were recorded. The sample mean and sample standard deviation were 6.15 ounces and 0.18 ounces, respectively. If we assume that the discharge amounts are normally distributed, is there enough evidence, at the 0.05 level of significance, to conclude that the true mean discharge, ,...
A coin-operated drink machine was designed to discharge a mean of 7 ounces of coffee per cup. In ...
 A coin-operated drink machine was designed to discharge a mean of 7 ounces of coffee per cup. In a test of the machine, the discharge amounts in 21 randomly chosen cups of coffee from the machine were recorded. The sample mean and sample standard deviation were 6.84 ounces and 0.3 ounces, respectively. If we assume that the discharge amounts are normally_distributed, is there enough evidence, at the 0.1 level of significance, to conclude that the true mean discharge, μ, differs...
A coin-operated drink machine was designed to discharge a mean of 7 ounces of coffee per...
 A coin-operated drink machine was designed to discharge a mean of 7 ounces of coffee per cup, In a test of the machine, the discharge amounts in 14 randomly chosen cups of coffee from the machine were recorded. The sample mean and sample standard deviation were 6.96 ounces and 0.12 ounces, respectively. If we assume that the discharge amounts are normally distributed, is there enough evidence, at the 0.05 level of significance, to conclude that the true mean discharge, H,...
A coin operated drink machine was designed to discharge a mean of 7 ounces of coffee...
 A coin operated drink machine was designed to discharge a mean of 7 ounces of coffee per cup. In a test of the machine, the discharge amounts in 14 randomly chosen cups of coffee from the machine were recorded. The sample mean and sample standard deviation were 7.02 ounces and 0.24 ounces, respectively. If we assume that the discharge amounts are normally distributed, is there enough evidence, at the 0.05 level of significance, to conclude that the true mean discharge,...
A coin-operated drink machine was designed to discharge a mean of 8 ounces of coffee per...
 A coin-operated drink machine was designed to discharge a mean of 8 ounces of coffee per cup. In a test of the machine, the discharge amounts in 21 randomly chosen cups of coffee from the machine were recorded. The sample mean and sample standard deviation were 7.87 ounces and 0.23 ounces, respectively. If we assume that the discharge amounts are normally distributed, is there enough evidence, at the 0.05 level of significance, to conclude that the true mean discharge, ?,...
A coin-operated drink machine was designed to discharge a mean of 8 ounces of coffee per...
 A coin-operated drink machine was designed to discharge a mean of 8 ounces of coffee per cup. In a test of the machine, the discharge amounts in 14 randomly chosen cups of coffee from the machine were recorded. The sample mean and sample standard deviation were 8.02 ounces and 0 26 ounces, respectively. If we assume that the discharge amounts are normally distributed, is there enough evidence, at the 0.05 level of significance, to conclude that the true mean discharge,...
A coin-operated coffee machine made by BIG Corporation was designed to discharge a mean of 6.9...
A coin-operated coffee machine made by BIG Corporation was designed to discharge a mean of 6.9 ounces of coffee per cup. If it dispenses more than that on average, the corporation may lose money, and if it dispenses less, the customers may complain. Believing that the mean amount of coffee μ dispensed by the machine is less than 6.9 ounces, BIG plans to do a statistical test of the claim that the machine is working as designed. BIG gathers a...
A coin-operated coffee machine was designed to discharge 8 ounces of coffee per cup, in a...
 A coin-operated coffee machine was designed to discharge 8 ounces of coffee per cup, in a test of the machine, 17 cupluls of coffee were drawn from the machine and measured. The number of ounces discharged for each of the cups is 7.9.7.76,773.775.8.14,8 15,786,788,7.67,8,8.12,813,784, 8.12, 8, 794.8.08 At the 0.02 level of significance, can we conclude (by using a sign test) that the median discharge of a cup of coffee from this machine differs from 8 ounces? Perform this hypothesis...
A laboratory claims that the mean sodium level, H, of a healthy adult is 139 mEq...
 A laboratory claims that the mean sodium level, H, of a healthy adult is 139 mEq per liter of blood. To test this claim, a random sample of 9 adult patients is evaluated. The mean sodium level for the sample is 141 mEq per liter of blood. It is known that the population standard deviation of adult sodium levels is 15 mEq. Assume that the population is normally distributed. Can we conclude, at the 0.05 level of significance, that the...
A laboratory claims that the mean sodium level, w, of a healthy adult is 139 meg...
 A laboratory claims that the mean sodium level, w, of a healthy adult is 139 meg per liter of blood. To test this claim, a random sample of 24 adult patients is evaluated. The mean sodium level for the sample is 134 mEq per liter of blood. It is known that the population standard deviation of adult sodium levels is 13 mEq. Assume that the population is normally distributed. Can we conclude, at the 0.01 level of significance, that the...
 A coin-operated drink machine was designed to discharge a mean of 6 ounces of coffee per cup. In a test of the machine, the discharge amounts in 12 randomly chosen cups of coffee from the machine were recorded. The sample mean and sample standard deviation were 6.15 ounces and 0.18 ounces, respectively. If we assume that the discharge amounts are normally distributed, is there enough evidence, at the 0.05 level of significance, to conclude that the true mean discharge, ,...
 A coin-operated drink machine was designed to discharge a mean of 7 ounces of coffee per cup. In a test of the machine, the discharge amounts in 21 randomly chosen cups of coffee from the machine were recorded. The sample mean and sample standard deviation were 6.84 ounces and 0.3 ounces, respectively. If we assume that the discharge amounts are normally_distributed, is there enough evidence, at the 0.1 level of significance, to conclude that the true mean discharge, μ, differs...
 A coin-operated drink machine was designed to discharge a mean of 7 ounces of coffee per cup, In a test of the machine, the discharge amounts in 14 randomly chosen cups of coffee from the machine were recorded. The sample mean and sample standard deviation were 6.96 ounces and 0.12 ounces, respectively. If we assume that the discharge amounts are normally distributed, is there enough evidence, at the 0.05 level of significance, to conclude that the true mean discharge, H,...
 A coin operated drink machine was designed to discharge a mean of 7 ounces of coffee per cup. In a test of the machine, the discharge amounts in 14 randomly chosen cups of coffee from the machine were recorded. The sample mean and sample standard deviation were 7.02 ounces and 0.24 ounces, respectively. If we assume that the discharge amounts are normally distributed, is there enough evidence, at the 0.05 level of significance, to conclude that the true mean discharge,...
 A coin-operated drink machine was designed to discharge a mean of 8 ounces of coffee per cup. In a test of the machine, the discharge amounts in 21 randomly chosen cups of coffee from the machine were recorded. The sample mean and sample standard deviation were 7.87 ounces and 0.23 ounces, respectively. If we assume that the discharge amounts are normally distributed, is there enough evidence, at the 0.05 level of significance, to conclude that the true mean discharge, ?,...
 A coin-operated drink machine was designed to discharge a mean of 8 ounces of coffee per cup. In a test of the machine, the discharge amounts in 14 randomly chosen cups of coffee from the machine were recorded. The sample mean and sample standard deviation were 8.02 ounces and 0 26 ounces, respectively. If we assume that the discharge amounts are normally distributed, is there enough evidence, at the 0.05 level of significance, to conclude that the true mean discharge,...
 A coin-operated coffee machine was designed to discharge 8 ounces of coffee per cup, in a test of the machine, 17 cupluls of coffee were drawn from the machine and measured. The number of ounces discharged for each of the cups is 7.9.7.76,773.775.8.14,8 15,786,788,7.67,8,8.12,813,784, 8.12, 8, 794.8.08 At the 0.02 level of significance, can we conclude (by using a sign test) that the median discharge of a cup of coffee from this machine differs from 8 ounces? Perform this hypothesis...
 A laboratory claims that the mean sodium level, H, of a healthy adult is 139 mEq per liter of blood. To test this claim, a random sample of 9 adult patients is evaluated. The mean sodium level for the sample is 141 mEq per liter of blood. It is known that the population standard deviation of adult sodium levels is 15 mEq. Assume that the population is normally distributed. Can we conclude, at the 0.05 level of significance, that the...
 A laboratory claims that the mean sodium level, w, of a healthy adult is 139 meg per liter of blood. To test this claim, a random sample of 24 adult patients is evaluated. The mean sodium level for the sample is 134 mEq per liter of blood. It is known that the population standard deviation of adult sodium levels is 13 mEq. Assume that the population is normally distributed. Can we conclude, at the 0.01 level of significance, that the...
Most questions answered within 3 hours.
-
1. Add hydrochloric acid (HCl) to magnesium metal in a test
tube.
Observations: &
asked 8 minutes ago -
Calculate the volume in milliliters of a 1.4 mol/L barium
acetate solution that contains 200.g of...
asked 8 minutes ago -
A consumer can choose between two gambles. The “sure thing”
guaranteesadditional income (I) of $250,000. The...
asked 9 minutes ago -
There are 9 women and 6 men in a department. A committee of four
is to...
asked 11 minutes ago -
Arthur Meiners is the production manager of Wheel-Rite, a small
producer of metal parts. Wheel-Rite supplies...
asked 26 minutes ago -
Company Risk Premium A company has a beta of
4.57. If the market return is expected...
asked 25 minutes ago -
3. Which statement about nuclear fission is correct? (1
point)
A. Nuclear fission provides energy for...
asked 31 minutes ago -
If a $2,000 increase in income leads to a $1,5000 increase in
consumption expenditures, then the...
asked 30 minutes ago -
May you please put this in layman's terms?
ABSTRACT
Coagulase-negative staphylococci (CoNS) and Staphylococcus
aureus are...
asked 35 minutes ago -
If authentic leadership is really a lifelong process,
can teenagers be authentic leaders? Why or why...
asked 51 minutes ago -
Six years of quarterly data of a seasonally adjusted series are
used to estimate a linear...
asked 1 hour ago -
Which of the following is not an ecological model used
to foster behavior change?
PRECEDE-PROCEED Model...
asked 1 hour ago