
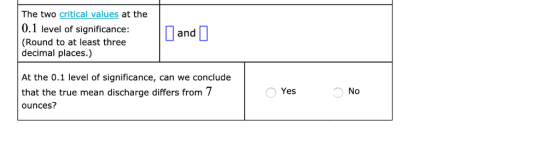
The two critical values at the 0.1 level of significance: (Round to at least three decimal places.) and At the 0.1 level of significance, can we conclude that the true mean discharge differs from 7 ounces? Yes No
Homework Answers
We want to test if the true mean discharge,  'differs' from 7 ounces, i.e., we want to test if
  .
.
Thus, our null and alternative hypothesis are given by:

Now, we are given the following details about the population :
1. The discharge amounts (population) is normally distributed.
2. Size of sample, n = 21
3. Sample mean, 
4. Sample standard deviation, s = 0.3
5. Level of significance,  = 0.1
= 0.1
Now, since the population is normally distributed and we don't have the value of the true population standard deviation, the test statistic which we use here is:
Under H0 :  , i.e., the t-statistic.
Thus, the value of the t-statistic is given by:

Now, the critical values at 0.1 level of significance are the
values of the t20 distribution the areas to the left of
which is  and
and  .
.
Thus, from the table of t20 distribution, we get:

which are our critical values.
Now, since our test statistic = -2.444 lies outside the interval
(-1.725,1.725) we can reject  at 0.1 level of significance and conclude that
  .
.
Thus, Yes, we can conclude that the true mean discharge differs from 7 ounces.
For any queries, feel free to comment and ask.
If the solution was helpful to you, don't forget to upvote it by clicking on the 'thumbs up' button.
Add Answer to:
A coin-operated drink machine was designed to discharge a mean of 7 ounces of coffee per cup. In ...
A coin-operated drink machine was designed to discharge a mean of 7 ounces of coffee per...
 A coin-operated drink machine was designed to discharge a mean of 7 ounces of coffee per cup, In a test of the machine, the discharge amounts in 14 randomly chosen cups of coffee from the machine were recorded. The sample mean and sample standard deviation were 6.96 ounces and 0.12 ounces, respectively. If we assume that the discharge amounts are normally distributed, is there enough evidence, at the 0.05 level of significance, to conclude that the true mean discharge, H,...
A coin-operated drink machine was designed to discharge a mean of 8 ounces of coffee per...
 A coin-operated drink machine was designed to discharge a mean of 8 ounces of coffee per cup. In a test of the machine, the discharge amounts in 21 randomly chosen cups of coffee from the machine were recorded. The sample mean and sample standard deviation were 7.87 ounces and 0.23 ounces, respectively. If we assume that the discharge amounts are normally distributed, is there enough evidence, at the 0.05 level of significance, to conclude that the true mean discharge, ?,...
A coin-operated drink machine was designed to discharge a mean of 9 ounces of coffee per...
 A coin-operated drink machine was designed to discharge a mean of 9 ounces of coffee per cup. In a test of the machine, the discharge amounts in 16 randomly chosen cups of coffee from the machine were recorded. The sample mean and sample standard deviation were 8.85 ounces and 0.25 ounces, respectively. If we assume that the discharge amounts are normally distributed, is there enough evidence, at the 0.1 level of significance, to conclude that the true mean discharge, H,...
A coin-operated drink machine was designed to discharge a mean of 6 ounces of coffee per...
 A coin-operated drink machine was designed to discharge a mean of 6 ounces of coffee per cup. In a test of the machine, the discharge amounts in 12 randomly chosen cups of coffee from the machine were recorded. The sample mean and sample standard deviation were 6.15 ounces and 0.18 ounces, respectively. If we assume that the discharge amounts are normally distributed, is there enough evidence, at the 0.05 level of significance, to conclude that the true mean discharge, ,...
A coin-operated drink machine was designed to discharge a mean of 8 ounces of coffee per...
 A coin-operated drink machine was designed to discharge a mean of 8 ounces of coffee per cup. In a test of the machine, the discharge amounts in 14 randomly chosen cups of coffee from the machine were recorded. The sample mean and sample standard deviation were 8.02 ounces and 0 26 ounces, respectively. If we assume that the discharge amounts are normally distributed, is there enough evidence, at the 0.05 level of significance, to conclude that the true mean discharge,...
A coin operated drink machine was designed to discharge a mean of 7 ounces of coffee...
 A coin operated drink machine was designed to discharge a mean of 7 ounces of coffee per cup. In a test of the machine, the discharge amounts in 14 randomly chosen cups of coffee from the machine were recorded. The sample mean and sample standard deviation were 7.02 ounces and 0.24 ounces, respectively. If we assume that the discharge amounts are normally distributed, is there enough evidence, at the 0.05 level of significance, to conclude that the true mean discharge,...
A coin-operated coffee machine was designed to discharge 8 ounces of coffee per cup, in a...
 A coin-operated coffee machine was designed to discharge 8 ounces of coffee per cup, in a test of the machine, 17 cupluls of coffee were drawn from the machine and measured. The number of ounces discharged for each of the cups is 7.9.7.76,773.775.8.14,8 15,786,788,7.67,8,8.12,813,784, 8.12, 8, 794.8.08 At the 0.02 level of significance, can we conclude (by using a sign test) that the median discharge of a cup of coffee from this machine differs from 8 ounces? Perform this hypothesis...
A coin-operated coffee machine made by BIG Corporation was designed to discharge a mean of 6.9...
A coin-operated coffee machine made by BIG Corporation was designed to discharge a mean of 6.9 ounces of coffee per cup. If it dispenses more than that on average, the corporation may lose money, and if it dispenses less, the customers may complain. Believing that the mean amount of coffee μ dispensed by the machine is less than 6.9 ounces, BIG plans to do a statistical test of the claim that the machine is working as designed. BIG gathers a...
A coin-operated coffee machine made by BIG Corporation was designed to discharge a mean of eight...
 A coin-operated coffee machine made by BIG Corporation was designed to discharge a mean of eight ounces of coffee per cup. If it dispenses more that that on average, the corporation may lose money, and if it dispenses less, the customers may complain BIG Corporation would like to estimate the mean amount of coffee, H, dispensed per cup by this machine. BIG will choose a random sample of cup amounts dispensed by this machine and use this sample to estimate...
A coin operated coffee machine made by BIG Corporation was designed to discharge amean of eight...
 A coin operated coffee machine made by BIG Corporation was designed to discharge amean of eight ounces of coffee Cup It dispenses more than that on average, the corporation may lose money, and it dispenseless, the customers complain BIG Corporation would like to estimate the mean amount of coffee dispensed per cup by this machine BIG wil choose a random sample of cup amounts dispersed by this machine and use the sample tom ate Assuming that the standard deviation of...
 A coin-operated drink machine was designed to discharge a mean of 7 ounces of coffee per cup, In a test of the machine, the discharge amounts in 14 randomly chosen cups of coffee from the machine were recorded. The sample mean and sample standard deviation were 6.96 ounces and 0.12 ounces, respectively. If we assume that the discharge amounts are normally distributed, is there enough evidence, at the 0.05 level of significance, to conclude that the true mean discharge, H,...
 A coin-operated drink machine was designed to discharge a mean of 8 ounces of coffee per cup. In a test of the machine, the discharge amounts in 21 randomly chosen cups of coffee from the machine were recorded. The sample mean and sample standard deviation were 7.87 ounces and 0.23 ounces, respectively. If we assume that the discharge amounts are normally distributed, is there enough evidence, at the 0.05 level of significance, to conclude that the true mean discharge, ?,...
 A coin-operated drink machine was designed to discharge a mean of 9 ounces of coffee per cup. In a test of the machine, the discharge amounts in 16 randomly chosen cups of coffee from the machine were recorded. The sample mean and sample standard deviation were 8.85 ounces and 0.25 ounces, respectively. If we assume that the discharge amounts are normally distributed, is there enough evidence, at the 0.1 level of significance, to conclude that the true mean discharge, H,...
 A coin-operated drink machine was designed to discharge a mean of 6 ounces of coffee per cup. In a test of the machine, the discharge amounts in 12 randomly chosen cups of coffee from the machine were recorded. The sample mean and sample standard deviation were 6.15 ounces and 0.18 ounces, respectively. If we assume that the discharge amounts are normally distributed, is there enough evidence, at the 0.05 level of significance, to conclude that the true mean discharge, ,...
 A coin-operated drink machine was designed to discharge a mean of 8 ounces of coffee per cup. In a test of the machine, the discharge amounts in 14 randomly chosen cups of coffee from the machine were recorded. The sample mean and sample standard deviation were 8.02 ounces and 0 26 ounces, respectively. If we assume that the discharge amounts are normally distributed, is there enough evidence, at the 0.05 level of significance, to conclude that the true mean discharge,...
 A coin operated drink machine was designed to discharge a mean of 7 ounces of coffee per cup. In a test of the machine, the discharge amounts in 14 randomly chosen cups of coffee from the machine were recorded. The sample mean and sample standard deviation were 7.02 ounces and 0.24 ounces, respectively. If we assume that the discharge amounts are normally distributed, is there enough evidence, at the 0.05 level of significance, to conclude that the true mean discharge,...
 A coin-operated coffee machine was designed to discharge 8 ounces of coffee per cup, in a test of the machine, 17 cupluls of coffee were drawn from the machine and measured. The number of ounces discharged for each of the cups is 7.9.7.76,773.775.8.14,8 15,786,788,7.67,8,8.12,813,784, 8.12, 8, 794.8.08 At the 0.02 level of significance, can we conclude (by using a sign test) that the median discharge of a cup of coffee from this machine differs from 8 ounces? Perform this hypothesis...
 A coin-operated coffee machine made by BIG Corporation was designed to discharge a mean of eight ounces of coffee per cup. If it dispenses more that that on average, the corporation may lose money, and if it dispenses less, the customers may complain BIG Corporation would like to estimate the mean amount of coffee, H, dispensed per cup by this machine. BIG will choose a random sample of cup amounts dispensed by this machine and use this sample to estimate...
 A coin operated coffee machine made by BIG Corporation was designed to discharge amean of eight ounces of coffee Cup It dispenses more than that on average, the corporation may lose money, and it dispenseless, the customers complain BIG Corporation would like to estimate the mean amount of coffee dispensed per cup by this machine BIG wil choose a random sample of cup amounts dispersed by this machine and use the sample tom ate Assuming that the standard deviation of...
Most questions answered within 3 hours.
-
A 10.000 g sample of water contains 11.19% H by mass. what
should be the %H...
asked 3 minutes ago -
Consider an investment game among 2 players. Each player can
either invest,
i, or not invest,-i....
asked 46 seconds ago -
The time taken to complete a particular task is normally
distributed with a standard deviation of...
asked 10 minutes ago -
we have heteroskedasticity in a regression when:
When the variance of error terms changes when an...
asked 20 minutes ago -
Explain some different types of fungi. State the different
divisions undergo by fungi.
asked 32 minutes ago -
The shortest time that 120 C can flow through a 20 A circuit
breaker without tripping...
asked 33 minutes ago -
A software design pattern is a general, reusable solution to a
commonly occurring problem, acting as...
asked 36 minutes ago -
The mean waiting time at the drive-through of a fast-food
restaurant from the time an order...
asked 52 minutes ago -
The pitch (p) of a helix is defined as p = dn, in which n is...
asked 54 minutes ago -
Do you agree that the declining stock of social capital is the
blame for the failure...
asked 58 minutes ago -
A researcher is interested in whether coffee consumption helps
with performance on reading comprehension tasks. The...
asked 1 hour ago -
it has been estimated since the beginning of the human race that
about 133 metric ton...
asked 1 hour ago