

Homework Answers
The given data of elevation and temperature is used to find out the difference in their elevation and temperature value which is again used for finding out the ELR value. We know that for atmospheric air if
ELR<DAR then the layer is stable
if ELR> DAR then the layer is unstable.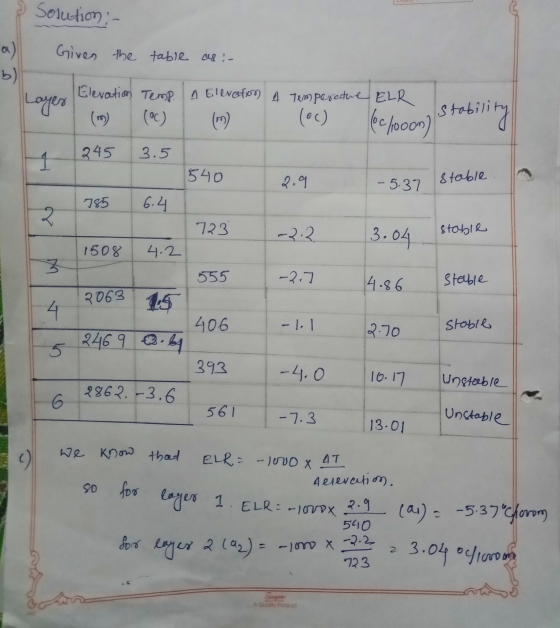

Add Answer to:
Help me to solve the table .
i really need anwers to this question . I...
The data on the table follow an exponential model y-aebx, Fill in the blanks 0.4 800...
 The data on the table follow an exponential model y-aebx, Fill in the blanks 0.4 800 [a1] [b1] [c1] [d1] 0.8 975 [a2] [b2] [c2] [d2] 1.2 1500 [a3] b3] [c3] [d3] 1.6 1950 [a4] b4] [c4] [d4] 2 2900 [a5 [b5] [c5] [d5 2.3 3600 [a6] [b6] [c6] [d6] Sum [a b c7] [d7] The average value of w is [e1] The average value of z is [e2] a1- [e3] a0- [e4] а» [e5] b- [e6]
assignament for excel...is there any way to upload the table this creates?? In this activity, we...
assignament for excel...is there any way to upload the table this creates?? In this activity, we use data from a random sample of women who participated in a study in 1986 at the Baystate Medical Center in Springfield, MA. (Source: Hosmer and Lemeshow (2000), Applied Logistic Regression: Second Edition.) For the 30 women in the study with a history of premature labor, a proportion of 18/30 = 0.60 (60%) had babies with low birth weight. For the remaining 159 women,...
Urgent!! Please show mark all correct answers and also find values of a1,a2,a3,a4,a5,a6 and b1,b2,b3,b4,b5,b6. Thank...
 Urgent!!
Please show mark all correct answers and also find values of
a1,a2,a3,a4,a5,a6 and b1,b2,b3,b4,b5,b6.
Thank you!
(1 point) The second order equation x?y" + xy' +(x2 - y = 0 has a regular singular point at x = 0, and therefore has a series solution y(x) = Σ CGxhtr P=0 The recurrence relation for the coefficients can be written in the form of n = 2, 3, ... C =( Jan-2 (The answer is a function of n and...
Urgent!!
Please show mark all correct answers and also find values of
a1,a2,a3,a4,a5,a6 and b1,b2,b3,b4,b5,b6.
Thank you!
(1 point) The second order equation x?y" + xy' +(x2 - y = 0 has a regular singular point at x = 0, and therefore has a series solution y(x) = Σ CGxhtr P=0 The recurrence relation for the coefficients can be written in the form of n = 2, 3, ... C =( Jan-2 (The answer is a function of n and...
All in MATLAB mixing_ratio function: function w = mixing_ratio(P,T) %function mixing_ratio has 2 inputs P in...
 All in MATLAB
mixing_ratio function:
function w = mixing_ratio(P,T) %function mixing_ratio has 2
inputs P in millibars and T in K
Po = 1013.246;
To = 373.16;
a1 = 11.344*(1-T/To);
a2 = -3.49149*(To/T - 1);
b1 = -7.90298*(To/T - 1);
b2 = 5.02808*log10(To/T);
b3 = -1.3816*(10^a1 -1)/(10^7);
b4 = 8.1328*(10^a2 -1)/(10^3);
b5 = log10(Po);
b = b1 + b2 + b3 + b4 + b5;
Pv = 10^b;
w = 0.62197*Pv/(P - Pv);
end
Appendix C Wetbulb Temperature As explained...
All in MATLAB
mixing_ratio function:
function w = mixing_ratio(P,T) %function mixing_ratio has 2
inputs P in millibars and T in K
Po = 1013.246;
To = 373.16;
a1 = 11.344*(1-T/To);
a2 = -3.49149*(To/T - 1);
b1 = -7.90298*(To/T - 1);
b2 = 5.02808*log10(To/T);
b3 = -1.3816*(10^a1 -1)/(10^7);
b4 = 8.1328*(10^a2 -1)/(10^3);
b5 = log10(Po);
b = b1 + b2 + b3 + b4 + b5;
Pv = 10^b;
w = 0.62197*Pv/(P - Pv);
end
Appendix C Wetbulb Temperature As explained...
Using Table 2 (average data of 10 brands x 10 attributes), (a) create a positioning map...
Using Table 2 (average data of 10 brands x 10 attributes), (a) create a positioning map by running SPSS, (b) put the overall mean (mean of all attributes per brand) on each brand, and (c) discuss which position must be appropriate for a new brand into the market. Table 2. Brand Positioning Mean Scores and Dimension Coordinates Mean scores (B = Brand and A = Attribute) BRAND A1 A2 A3 A4 A5 A6 A7 A8 A9 A10 B1 3.87 3.13...
Styles First we will learn how to evaluate binomial distribution with the help of Excel. Let's...
 Styles First we will learn how to evaluate binomial distribution with the help of Excel. Let's flip a coin n times and count how many tails we are going to get. If n=0, then no coin is tossed and the only option is 0 tails. Therefore P(0)=1, the mean is 0 and the standard deviation is 0. We are going to do a simple table for n=0. First we will define columns. Click on cell A1 and type X for...
I need help putting this into Excel as I'm not sure how to find answers to...
I need help putting this into Excel as I'm not sure how to find answers to these questions. I've only put part of the table in, otherwise it's too long. Any help is greatly appreciated! A) Develop the following simple linear regression models to predict the sale price of a house based upon a 90% level of confidence. A1) Write the regression equation for each model. A2) Sale price based upon square feet of living area. A3) Sale price based...
 The data on the table follow an exponential model y-aebx, Fill in the blanks 0.4 800 [a1] [b1] [c1] [d1] 0.8 975 [a2] [b2] [c2] [d2] 1.2 1500 [a3] b3] [c3] [d3] 1.6 1950 [a4] b4] [c4] [d4] 2 2900 [a5 [b5] [c5] [d5 2.3 3600 [a6] [b6] [c6] [d6] Sum [a b c7] [d7] The average value of w is [e1] The average value of z is [e2] a1- [e3] a0- [e4] а» [e5] b- [e6]
 Urgent!!
Please show mark all correct answers and also find values of
a1,a2,a3,a4,a5,a6 and b1,b2,b3,b4,b5,b6.
Thank you!
(1 point) The second order equation x?y" + xy' +(x2 - y = 0 has a regular singular point at x = 0, and therefore has a series solution y(x) = Σ CGxhtr P=0 The recurrence relation for the coefficients can be written in the form of n = 2, 3, ... C =( Jan-2 (The answer is a function of n and...
Urgent!!
Please show mark all correct answers and also find values of
a1,a2,a3,a4,a5,a6 and b1,b2,b3,b4,b5,b6.
Thank you!
(1 point) The second order equation x?y" + xy' +(x2 - y = 0 has a regular singular point at x = 0, and therefore has a series solution y(x) = Σ CGxhtr P=0 The recurrence relation for the coefficients can be written in the form of n = 2, 3, ... C =( Jan-2 (The answer is a function of n and...
 All in MATLAB
mixing_ratio function:
function w = mixing_ratio(P,T) %function mixing_ratio has 2
inputs P in millibars and T in K
Po = 1013.246;
To = 373.16;
a1 = 11.344*(1-T/To);
a2 = -3.49149*(To/T - 1);
b1 = -7.90298*(To/T - 1);
b2 = 5.02808*log10(To/T);
b3 = -1.3816*(10^a1 -1)/(10^7);
b4 = 8.1328*(10^a2 -1)/(10^3);
b5 = log10(Po);
b = b1 + b2 + b3 + b4 + b5;
Pv = 10^b;
w = 0.62197*Pv/(P - Pv);
end
Appendix C Wetbulb Temperature As explained...
All in MATLAB
mixing_ratio function:
function w = mixing_ratio(P,T) %function mixing_ratio has 2
inputs P in millibars and T in K
Po = 1013.246;
To = 373.16;
a1 = 11.344*(1-T/To);
a2 = -3.49149*(To/T - 1);
b1 = -7.90298*(To/T - 1);
b2 = 5.02808*log10(To/T);
b3 = -1.3816*(10^a1 -1)/(10^7);
b4 = 8.1328*(10^a2 -1)/(10^3);
b5 = log10(Po);
b = b1 + b2 + b3 + b4 + b5;
Pv = 10^b;
w = 0.62197*Pv/(P - Pv);
end
Appendix C Wetbulb Temperature As explained...
 Styles First we will learn how to evaluate binomial distribution with the help of Excel. Let's flip a coin n times and count how many tails we are going to get. If n=0, then no coin is tossed and the only option is 0 tails. Therefore P(0)=1, the mean is 0 and the standard deviation is 0. We are going to do a simple table for n=0. First we will define columns. Click on cell A1 and type X for...
Most questions answered within 3 hours.
-
There are four (4) major financial statements: Income Statement,
Retained Earning (Owner's Equity) Statement, Balance Sheet,...
asked 2 minutes ago -
A) Banana, Inc. has a book value per share of $8.70, earnings
per share of $1.68,...
asked 3 minutes ago -
a.)Suppose you were
preparing 1.0 L of a bleaching solution in a volumetric flask, and
it...
asked 13 minutes ago -
write a personal statement of 500 words on the impact you strive
to make using a...
asked 5 minutes ago -
At 25.0 mL sample of 0.100 M HClO (aq) is titrated with NaOH
(aq). What is...
asked 20 minutes ago -
Mark launders his white clothes using the production
function
q=2B +G,
where B is the number...
asked 35 minutes ago -
the flowing is true or fuels with correct
Catalyst may change chemically but remains unchanged
physically
asked 47 minutes ago -
Week 9: Leadership
1. Define what is meant by the terms ‘leader’ and ‘leadership’.
Why is...
asked 49 minutes ago -
Choose a point at random in the square withsides 0≤x≤1and0≤y≤1.
This means that the probabilitythat the...
asked 55 minutes ago -
Generally, for losses arising in tax years after 2017, the NOL
deduction cannot exceed ______.
asked 58 minutes ago -
Can you help with how to answer 8 and 9? I do not see those 2...
asked 59 minutes ago -
At a certain temperature, 0.680 mol of SO3 is placed in a 2.00-L
container. At equilibrium,...
asked 1 hour ago