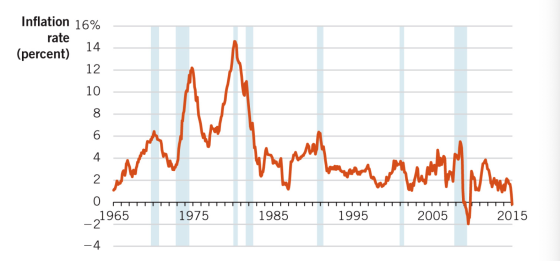
The following graph shows the inflation rate in the US between 1965 and 2015
.
-
- From 1965 to 1995, does CPI in the US always increase over time? Explain.
- Suppose 2009 is the base year, and the inflation rate between 2009 and 2010 is -2%.
- What is the CPI in 2009?
- Calculate the CPI in 2010.
- Between 2009 and 2010, the nominal interest rate is 3%, calculate the real interest rate.
Homework Answers
Solution:
Interest rate = (CPIt+1 - CPIt)*100/CPIt
where CPIt+1 is consumer price index in year t + 1, and CPIt is consumer price index in year t.
Further CPIt = (cost of market basket in year t/cost of market basket in base year)*100
So, as CPI can never be negative, if the interest rate is positive, it means CPI in next year is greater than that in previous year. Similarly, if interest rate is negative, it means that CPI in next year is less than CPI in previous year.
a) From 1965 to 1995, we can easily see in the graph that interest rate is always positive, so yes, CPI in the US seems to have increased over time in this period (reason mentioned above mathematically).
b) Base year as 2009, inflation rate between 2009 and 2010 = -2% or -0.02
ii) CPI in 2009 = (Cost of market basket in 2009/cost of market basket in base year, which is 2009)*100
CPI in 2009 = 1*100 = 100
Note that CPI in base year, thus, is always 100.
iii) inflation rate = (CPI in 2010 - CPI in 2009)*100/CPI in 2009
-0.02 = (CPI in 2010 - 100)*100/100
CPI in 2010 = -0.02 + 100 = 99.98
iv) Real interest rate = (1 + nominal interest rate)/(1 + inflation rate) - 1
Real interest rate = (1 + 3%)/(1 + (-2%)) - 1
Real interest rate = (1 + 0.03)/(1 - 0.02) - 1
Real interest rate = 1.051 - 1 = 0.051 or 5.1%
(Approximation says real interest rate is approximately equal to nominal interest rate - inflation rate; so, real interest rate = 3% - (-2%) = 5% approximately, which is true).
Add Answer to:
The following graph shows the inflation rate in the US between
1965 and 2015
.
From...
The following graph shows the inflation rate in the US between 1965 and 2015. (a) From...
 The following graph shows the inflation rate in the US between
1965 and 2015.
(a) From 1965 to 1995, does CPI in the US always increase over
time? Explain.
(b) Suppose 2009 is the base year, and the inflation rate
between 2009 and 2010 is -2%. (i) What is the CPI in 2009? (ii)
Calculate the CPI in 2010. (iii) Between 2009 and 2010, the nominal
interest rate is 3%, calculate the real interest rate.
(c) Between 1970 and 1985,...
The following graph shows the inflation rate in the US between
1965 and 2015.
(a) From 1965 to 1995, does CPI in the US always increase over
time? Explain.
(b) Suppose 2009 is the base year, and the inflation rate
between 2009 and 2010 is -2%. (i) What is the CPI in 2009? (ii)
Calculate the CPI in 2010. (iii) Between 2009 and 2010, the nominal
interest rate is 3%, calculate the real interest rate.
(c) Between 1970 and 1985,...
The following graph shows the inflation rate in the US between 1965 and 2015. Inflation 16%...
 The following graph shows the inflation rate in the US between 1965 and 2015. Inflation 16% rate 14 (percent) 12 10 8 6 4 rumah un 2 0 1975 1985 1995 2005 -21965 2015 -4 (a) From 1965 to 1995, does CPI in the US always increase over time? Explain. (b) Suppose 2009 is the base year, and the inflation rate between 2009 and 2010 is -2%. (i) What is the CPI in 2009? (ii) Calculate the CPI in 2010....
The following graph shows the inflation rate in the US between 1965 and 2015. a. Between...
 The following graph shows the inflation rate in the US between
1965 and 2015.
a. Between 1970 and 1985, inflation rate fluctuated severely.
Firms might be unwilling to buy raw materials to produce at that
time. Explain (This is related to the cost of inflation.)
b. Is it possible that CPI increases but GDP deflator decreases?
Explain.
Inflation 16% rate 14 (percent) 12 10 8 6 4 typ harth 2 0 1965 1975 1985 1995 2005 2015 -4
The following graph shows the inflation rate in the US between
1965 and 2015.
a. Between 1970 and 1985, inflation rate fluctuated severely.
Firms might be unwilling to buy raw materials to produce at that
time. Explain (This is related to the cost of inflation.)
b. Is it possible that CPI increases but GDP deflator decreases?
Explain.
Inflation 16% rate 14 (percent) 12 10 8 6 4 typ harth 2 0 1965 1975 1985 1995 2005 2015 -4
The following graph shows the inflation rate in the US between 1965 and 2015. Between 1970...
 The following graph shows the inflation rate in the US between
1965 and 2015.
Between 1970 and 1985, inflation rate fluctuated severely.
Firms might be unwilling to buy raw materials to produce at that
time. Explain (This is related to the cost of inflation.)
Suppose that CPI in 1985 is 80 and the CPI in 2015 is 188. You
earned $60,000 in 1985, and you earned $119,000 in 2015. Do you
have a higher real income in 1985 or in...
The following graph shows the inflation rate in the US between
1965 and 2015.
Between 1970 and 1985, inflation rate fluctuated severely.
Firms might be unwilling to buy raw materials to produce at that
time. Explain (This is related to the cost of inflation.)
Suppose that CPI in 1985 is 80 and the CPI in 2015 is 188. You
earned $60,000 in 1985, and you earned $119,000 in 2015. Do you
have a higher real income in 1985 or in...
2 Understanding and Calculating Inflation Real and Nominal Interest Rates in the United States, 1960-2015 Percent...
 2 Understanding and Calculating Inflation Real and Nominal Interest Rates in the United States, 1960-2015 Percent 16 14 Nominal Real 1960 1965 1970 1975 1980 1985 1990 1995 2000 2005 2010 2015 Year Figure 2: Real and nominal interest rates in the US, 1960-2015 1. State the Fisher equation. What do the three variables in Fisher's equation represent? 2. Consider Figure 2. Why do negative real interest rates occur? Are they a problem for the economy? 3. In Figure 2,...
The accompanying table shows data on nominal GDP (in billions of dollars), real GDP (in billions of 2009 dollars)
The accompanying table shows data on nominal GDP (in billions of dollars), real GDP (in billions of 2009 dollars), and population (in thousands) of the United States in 1965,1975,1985,1995,2005, and 2015 . The U.S. price level rose consistently over the period 1965-2015.YearNominal GDP (billions of dollars)Real GDP (billions of 2009 dollars)Population (thousands)1965$743.7$3,976.7194,25019751,688.95,385.4215,89119854,346.77,593.8238,41619957,664.110,174.8266,458200513,093.714,234.2296,115201517,947.016,348.9321,601a. Why is real GDP greater than nominal GDP for all years until 2005 and lower for 2015 ?b. Calculate the percent change in real GDP from 1965 to...
The table below shows production and prices for a stylized economy. Assume the base year is...
 The table below shows production and prices for a stylized economy. Assume the base year is 2005. Price per unit of X(S) Production of Y Price per unit Year Production of X of Y (S) 2005 200 units 500 2010 2015 300 units 400 units Calculate nominal and real GDP for 2005, 2010 and 2015 assuming the base year is 2005 Calculate the GDP deflator for 2005, 2010, and 2015. What is the inflation rate between 2005 and 2010? Between...
5. Inflation and the nominal interest rate The following graph shows the supply and demand curves...
 5. Inflation and the nominal interest rate The following graph shows the supply and demand curves in the market for loanable funds when actual inflation and expected inflation are zero. Suppose the expected inflation rate increases to 4%. Adjust the following graph to show the effect of this increase in the expected inflation rate. INTEREST RATE 500 100 200 300 400 QUANTITY OF LOANABLE FUNDS An expected inflation rate of 4% results in a nominal interest rate of and a...
People anticipate the inflation rate to be 8%. Banks are making loans at a 12% interest...
 People anticipate the inflation rate to be 8%. Banks are making loans at a 12% interest rate. Therefore, O A. the real rate of interest is 12% and the nominal rate is 4% OB. the real rate of interest is 12% and the nominal rate is 8% O C. the real rate of interest is 4% and the nominal rate is 12% O D. the real rate of interest is 8% and the nominal rate is -4% You are negotiating...
The line graph shows how the personal computer (PC) has evolved over three decades of its...
 The line graph shows how the personal computer (PC) has evolved over three decades of its existence. Worldwide PC sales from 1985 to 2015 Use the line graph to find the increase in the estimated number of PCs to be sold in 2015 from the number sold in 1985. festimale 3033 Sales (in Millions) 200 1926 138.1 1985 1990 1995 2000 2005 2010 2015 The increase in PC sales from 1985 to the estimate for 2015 is b million (Type...
 The following graph shows the inflation rate in the US between
1965 and 2015.
(a) From 1965 to 1995, does CPI in the US always increase over
time? Explain.
(b) Suppose 2009 is the base year, and the inflation rate
between 2009 and 2010 is -2%. (i) What is the CPI in 2009? (ii)
Calculate the CPI in 2010. (iii) Between 2009 and 2010, the nominal
interest rate is 3%, calculate the real interest rate.
(c) Between 1970 and 1985,...
The following graph shows the inflation rate in the US between
1965 and 2015.
(a) From 1965 to 1995, does CPI in the US always increase over
time? Explain.
(b) Suppose 2009 is the base year, and the inflation rate
between 2009 and 2010 is -2%. (i) What is the CPI in 2009? (ii)
Calculate the CPI in 2010. (iii) Between 2009 and 2010, the nominal
interest rate is 3%, calculate the real interest rate.
(c) Between 1970 and 1985,...
 The following graph shows the inflation rate in the US between 1965 and 2015. Inflation 16% rate 14 (percent) 12 10 8 6 4 rumah un 2 0 1975 1985 1995 2005 -21965 2015 -4 (a) From 1965 to 1995, does CPI in the US always increase over time? Explain. (b) Suppose 2009 is the base year, and the inflation rate between 2009 and 2010 is -2%. (i) What is the CPI in 2009? (ii) Calculate the CPI in 2010....
 The following graph shows the inflation rate in the US between
1965 and 2015.
a. Between 1970 and 1985, inflation rate fluctuated severely.
Firms might be unwilling to buy raw materials to produce at that
time. Explain (This is related to the cost of inflation.)
b. Is it possible that CPI increases but GDP deflator decreases?
Explain.
Inflation 16% rate 14 (percent) 12 10 8 6 4 typ harth 2 0 1965 1975 1985 1995 2005 2015 -4
The following graph shows the inflation rate in the US between
1965 and 2015.
a. Between 1970 and 1985, inflation rate fluctuated severely.
Firms might be unwilling to buy raw materials to produce at that
time. Explain (This is related to the cost of inflation.)
b. Is it possible that CPI increases but GDP deflator decreases?
Explain.
Inflation 16% rate 14 (percent) 12 10 8 6 4 typ harth 2 0 1965 1975 1985 1995 2005 2015 -4
 The following graph shows the inflation rate in the US between
1965 and 2015.
Between 1970 and 1985, inflation rate fluctuated severely.
Firms might be unwilling to buy raw materials to produce at that
time. Explain (This is related to the cost of inflation.)
Suppose that CPI in 1985 is 80 and the CPI in 2015 is 188. You
earned $60,000 in 1985, and you earned $119,000 in 2015. Do you
have a higher real income in 1985 or in...
The following graph shows the inflation rate in the US between
1965 and 2015.
Between 1970 and 1985, inflation rate fluctuated severely.
Firms might be unwilling to buy raw materials to produce at that
time. Explain (This is related to the cost of inflation.)
Suppose that CPI in 1985 is 80 and the CPI in 2015 is 188. You
earned $60,000 in 1985, and you earned $119,000 in 2015. Do you
have a higher real income in 1985 or in...
 2 Understanding and Calculating Inflation Real and Nominal Interest Rates in the United States, 1960-2015 Percent 16 14 Nominal Real 1960 1965 1970 1975 1980 1985 1990 1995 2000 2005 2010 2015 Year Figure 2: Real and nominal interest rates in the US, 1960-2015 1. State the Fisher equation. What do the three variables in Fisher's equation represent? 2. Consider Figure 2. Why do negative real interest rates occur? Are they a problem for the economy? 3. In Figure 2,...
 The table below shows production and prices for a stylized economy. Assume the base year is 2005. Price per unit of X(S) Production of Y Price per unit Year Production of X of Y (S) 2005 200 units 500 2010 2015 300 units 400 units Calculate nominal and real GDP for 2005, 2010 and 2015 assuming the base year is 2005 Calculate the GDP deflator for 2005, 2010, and 2015. What is the inflation rate between 2005 and 2010? Between...
 5. Inflation and the nominal interest rate The following graph shows the supply and demand curves in the market for loanable funds when actual inflation and expected inflation are zero. Suppose the expected inflation rate increases to 4%. Adjust the following graph to show the effect of this increase in the expected inflation rate. INTEREST RATE 500 100 200 300 400 QUANTITY OF LOANABLE FUNDS An expected inflation rate of 4% results in a nominal interest rate of and a...
 People anticipate the inflation rate to be 8%. Banks are making loans at a 12% interest rate. Therefore, O A. the real rate of interest is 12% and the nominal rate is 4% OB. the real rate of interest is 12% and the nominal rate is 8% O C. the real rate of interest is 4% and the nominal rate is 12% O D. the real rate of interest is 8% and the nominal rate is -4% You are negotiating...
 The line graph shows how the personal computer (PC) has evolved over three decades of its existence. Worldwide PC sales from 1985 to 2015 Use the line graph to find the increase in the estimated number of PCs to be sold in 2015 from the number sold in 1985. festimale 3033 Sales (in Millions) 200 1926 138.1 1985 1990 1995 2000 2005 2010 2015 The increase in PC sales from 1985 to the estimate for 2015 is b million (Type...
Most questions answered within 3 hours.
-
Which of the following pairs of ions have the same electron
configuration?
I: Br− and Se2−...
asked 2 hours ago -
The Foremost Composite Materials Company is planning a two-day
sales conference for October 19-20. The conference...
asked 2 hours ago -
3) Illustrate the observed pattern of relatedness of organisms
versus adaptations to specific conditions. This means...
asked 3 hours ago -
In winter a lake has a 0.35 m thick ice layer over 1.10 m of
water....
asked 4 hours ago -
Assuming the following has been encrypted with a Vigenere cipher
below, use the method(s) and assumptions...
asked 4 hours ago -
How would I use switch statements to write a program that will
take an input of...
asked 4 hours ago -
Imagine a reaction in which methane gas combusts at a constant
pressure of 1 atm and...
asked 4 hours ago -
Two parallel wires (each 12 m in length) are separated by a
distance of 0.065 m...
asked 4 hours ago -
Suppose there were three masses at the corner of uniform
equilateral triangle. The masses are m1...
asked 4 hours ago -
Situation: A building that is 618 m above the ground floor. How
many times would a...
asked 4 hours ago -
help me and discuss one successful and one
unsuccessful international company/busines in Indonesia.whyit
succeed and why...
asked 4 hours ago -
I- Choose the best answer
Which of the following statements about the structure and
packaging of...
asked 4 hours ago